

from various paleoindicators (Figure 1). This does
not mean, however, that we understand the carbon
cycle (and climate) trends of the Cenozoic, since
different models can produce similar trends from
completely different underlying mechanisms. To be
reliable, models should not rest only on a limited set
of data but should be able to explain a wide range of
geochemical records.
Conclusions
Proxy records indicate that the Earth’s climate
cooled gradually over the Cenozoic. This cooling
trend was accompanied by a decrease of atmospheric
PCO 2 . Other striking features of the Cenozoic are the
sharp increase of the
87 Sr/
86 Sr ratio of sea water and
the overall deepening of the lysocline from late Eocene time to the present, and after the mid-Miocene a
marked decrease of ocean d
13
C together with an increase in total carbonate accumulation and possibly
phosphorus deposition. Are these environmental
changes related? The role of models is to synthesize
and provide a coherent explanation of such records,
and then reconstruct the history of other key variables not directly accessible from paleodata. Today,
we are still far from this goal. It is fundamental that
models use multiple proxy data both as forcings and
for validation, implying that other biogeochemical
cycles for which proxies are available are modeled
together with the carbon cycle. A coupling to other
major biogeochemical cycles is also essential because
of the interactions with the carbon cycle and the
feedbacks involved.
See also
Calcium Carbonates. Carbon Cycle. Cenozoic
Climate – Oxygen Isotope Evidence. Ocean
Carbon System, Modeling of. Past Climate From
Corals. River Inputs. Stable Carbon Isotope
Variations in the Ocean.
Further Reading
Berner RA (1990) Atmospheric carbon dioxide levels over
Phanerozoic time. Science 249: 1382--1386.
Berner RA (1998) The carbon cycle and CO 2 over
Phanerozoic time: the role of land plants. Philosophical
Transactions of the Royal Society of London B 353:
75--82.
Broecker WS and Peng TH (1982) Tracers in the Sea.
Palisades: Eldigio Press.
Butcher SS, Charlson RJ, Orians GH, and Wolfe GV (eds.)
(1992) Global Biogeochemical Cycles. London:
Academic Press.
Chameides WL and Perdue EM (1997) Biogeochemical
Cycles: A Computer-Interactive Study of Earth System
Science and Global Change. Oxford: Oxford University
Press.
Fo ¨ llmi KB (1995) 160 My record of marine sedimentary
phosphorus burial: coupling of climate and continental
weathering under greenhouse and icehouse conditions.
Geology 23: 859--862.
France-Lanord C and Derry LA (1997) Organic carbon
burial forcing of the carbon cycle from Himalayan
erosion. Nature 390: 65--67.
Franc¸ ois LM and Walker JCG (1992) Modelling the
Phanerozoic carbon cycle and climate: constraints from
the
87
Sr/
86 Sr isotopic ratio of sea water. American
Journal of Science 292: 81--135.
Freeman KH and Hayes JM (1992) Fractionation of
carbon isotopes by phytoplankton and estimates of
70
60
50
40
30
20
10
0
Age (Ma)
4
5
6
7
8
Continental silicate weathering (10
12
mol y
_1
)
Cr
Cenozoic
Late Paleoc
Eocene
Oligocene
Miocene
Pl
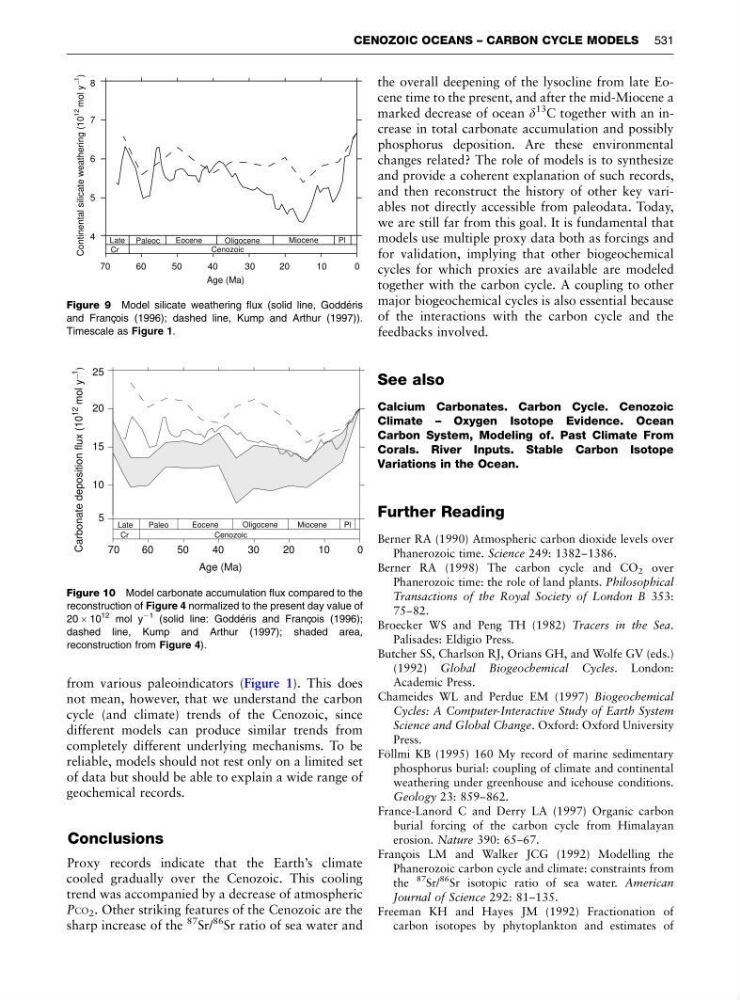
Figure 9 Model silicate weathering flux (solid line, Godde ´ ris
and Franc¸ ois (1996); dashed line, Kump and Arthur (1997)).
Timescale as Figure 1.
70
60
50
40
30
20
10
0
Age (Ma)
5
10
15
20
25
Carbonate deposition flux (10
12
mol y
_
1
)
Cr
Cenozoic
Late
Paleo
Eocene
Oligocene
Miocene
Pl
Figure 10 Model carbonate accumulation flux compared to the
reconstruction of Figure 4 normalized to the present day value of
20 Â 10
12 mol y
À1 (solid line: Godde ´ ris and Franc¸ ois (1996);
dashed line, Kump and Arthur (1997); shaded area,
reconstruction from Figure 4).
CENOZOIC OCEANS – CARBON CYCLE MODELS 531
not mean, however, that we understand the carbon
cycle (and climate) trends of the Cenozoic, since
different models can produce similar trends from
completely different underlying mechanisms. To be
reliable, models should not rest only on a limited set
of data but should be able to explain a wide range of
geochemical records.
Conclusions
Proxy records indicate that the Earth’s climate
cooled gradually over the Cenozoic. This cooling
trend was accompanied by a decrease of atmospheric
PCO 2 . Other striking features of the Cenozoic are the
sharp increase of the
87 Sr/
86 Sr ratio of sea water and
the overall deepening of the lysocline from late Eocene time to the present, and after the mid-Miocene a
marked decrease of ocean d
13
C together with an increase in total carbonate accumulation and possibly
phosphorus deposition. Are these environmental
changes related? The role of models is to synthesize
and provide a coherent explanation of such records,
and then reconstruct the history of other key variables not directly accessible from paleodata. Today,
we are still far from this goal. It is fundamental that
models use multiple proxy data both as forcings and
for validation, implying that other biogeochemical
cycles for which proxies are available are modeled
together with the carbon cycle. A coupling to other
major biogeochemical cycles is also essential because
of the interactions with the carbon cycle and the
feedbacks involved.
See also
Calcium Carbonates. Carbon Cycle. Cenozoic
Climate – Oxygen Isotope Evidence. Ocean
Carbon System, Modeling of. Past Climate From
Corals. River Inputs. Stable Carbon Isotope
Variations in the Ocean.
Further Reading
Berner RA (1990) Atmospheric carbon dioxide levels over
Phanerozoic time. Science 249: 1382--1386.
Berner RA (1998) The carbon cycle and CO 2 over
Phanerozoic time: the role of land plants. Philosophical
Transactions of the Royal Society of London B 353:
75--82.
Broecker WS and Peng TH (1982) Tracers in the Sea.
Palisades: Eldigio Press.
Butcher SS, Charlson RJ, Orians GH, and Wolfe GV (eds.)
(1992) Global Biogeochemical Cycles. London:
Academic Press.
Chameides WL and Perdue EM (1997) Biogeochemical
Cycles: A Computer-Interactive Study of Earth System
Science and Global Change. Oxford: Oxford University
Press.
Fo ¨ llmi KB (1995) 160 My record of marine sedimentary
phosphorus burial: coupling of climate and continental
weathering under greenhouse and icehouse conditions.
Geology 23: 859--862.
France-Lanord C and Derry LA (1997) Organic carbon
burial forcing of the carbon cycle from Himalayan
erosion. Nature 390: 65--67.
Franc¸ ois LM and Walker JCG (1992) Modelling the
Phanerozoic carbon cycle and climate: constraints from
the
87
Sr/
86 Sr isotopic ratio of sea water. American
Journal of Science 292: 81--135.
Freeman KH and Hayes JM (1992) Fractionation of
carbon isotopes by phytoplankton and estimates of
70
60
50
40
30
20
10
0
Age (Ma)
4
5
6
7
8
Continental silicate weathering (10
12
mol y
_1
)
Cr
Cenozoic
Late Paleoc
Eocene
Oligocene
Miocene
Pl
Figure 9 Model silicate weathering flux (solid line, Godde ´ ris
and Franc¸ ois (1996); dashed line, Kump and Arthur (1997)).
Timescale as Figure 1.
70
60
50
40
30
20
10
0
Age (Ma)
5
10
15
20
25
Carbonate deposition flux (10
12
mol y
_
1
)
Cr
Cenozoic
Late
Paleo
Eocene
Oligocene
Miocene
Pl
Figure 10 Model carbonate accumulation flux compared to the
reconstruction of Figure 4 normalized to the present day value of
20 Â 10
12 mol y
À1 (solid line: Godde ´ ris and Franc¸ ois (1996);
dashed line, Kump and Arthur (1997); shaded area,
reconstruction from Figure 4).
CENOZOIC OCEANS – CARBON CYCLE MODELS 531