

bacterial mediation. There is no evidence that Ce
oxidation continues in the deep sea. The deviation of
Ce from other trivalent REEs in geochemical behavior is generally expressed as ‘Ce-anomaly’ which
is defined by the following equation,
Ce=Ce * ¼ 2 Ce
½ = La
½ þ ½Pr
ð
Þ
or
Ce=Ce * ¼ 3 Ce
½ = La
½ þ 2 Nd
½
ð
Þ
where [] indicates shale-normalized value of the REE
concentration. The negative Ce-anomaly implies Ce/
Ce * o1, vice versa. In the open oceans, the negative
Ce-anomaly is developed with increasing depth
(Figure 7) because of a decrease in Ce coinciding
with increases in La and Pr (or Nd) concentrations.
In the aoxic basins, Ce
4þ is reduced to Ce
3þ and
the Ce-anomaly tends to be smaller than those in
oxygenated waters. The Black Sea provides a best
example in which Ce/Ce * sharply increases from less
4.7
40 ˚ N
0 ˚
20 ˚ N
40 ˚ S
40°N
0°
20°N
20°S
40°S
100 ˚ E
120 ˚ E
140 ˚ E
80 ˚ E
100 ˚ E
120 ˚ E
140 ˚ E
80 ˚ E
18.9
19.6(PA10)
18.4(PA9)
14.5
7.0
7.0
15.5
12.8
11.3
11.8
7.3
8.8
12.4
12.4
13.9(PA11)
11.2
10.6
9.5
+2.8
+3.6
3.2+
3.3+
+
3.1 4.1
4.8
3.1
2.8
9.2(PA1)
6.5
9.0
7.3
13.5
8.7(PA2)
7.1
7.4
5.4 5.9
5.0
5.6
3.8
3.0
4.1
4.8
(PA4)
(A)
(F)
(B)
(G)
(C)
(H)
(D)
(I)
(E)
(in Fig. 9)
4.6
(PA5)
7.4(PA7)
Nd concentration
(pmol kg
_ 1
)
20 ˚ S
12.9
(B)
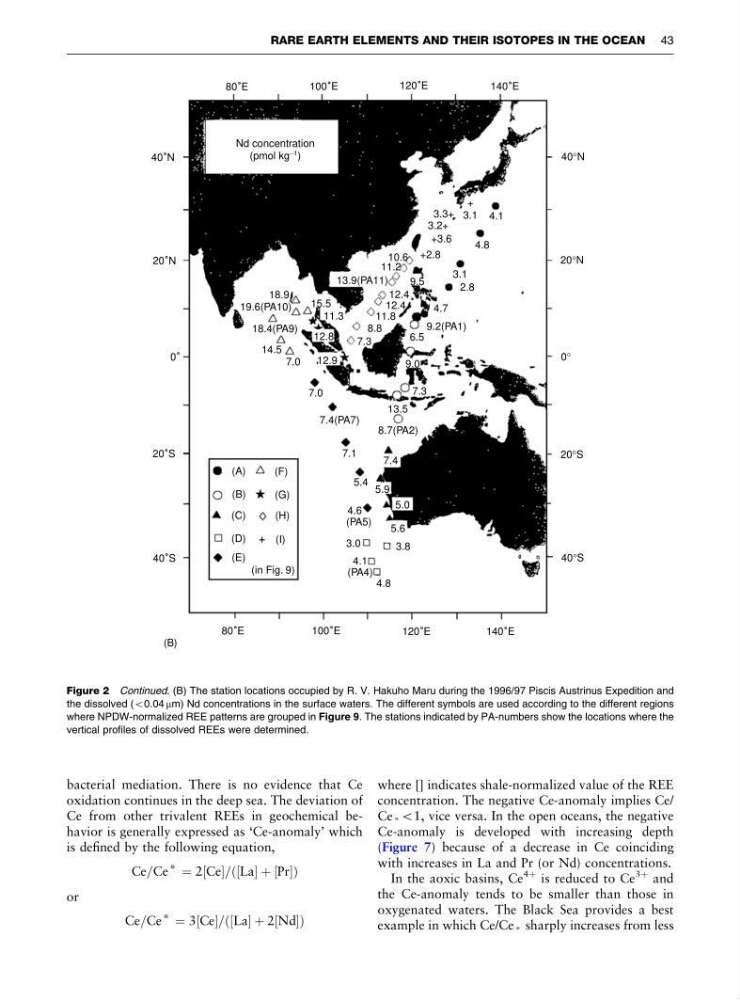
Figure 2 Continued. (B) The station locations occupied by R. V. Hakuho Maru during the 1996/97 Piscis Austrinus Expedition and
the dissolved (o0.04 mm) Nd concentrations in the surface waters. The different symbols are used according to the different regions
where NPDW-normalized REE patterns are grouped in Figure 9. The stations indicated by PA-numbers show the locations where the
vertical profiles of dissolved REEs were determined.
RARE EARTH ELEMENTS AND THEIR ISOTOPES IN THE OCEAN 43
oxidation continues in the deep sea. The deviation of
Ce from other trivalent REEs in geochemical behavior is generally expressed as ‘Ce-anomaly’ which
is defined by the following equation,
Ce=Ce * ¼ 2 Ce
½ = La
½ þ ½Pr
ð
Þ
or
Ce=Ce * ¼ 3 Ce
½ = La
½ þ 2 Nd
½
ð
Þ
where [] indicates shale-normalized value of the REE
concentration. The negative Ce-anomaly implies Ce/
Ce * o1, vice versa. In the open oceans, the negative
Ce-anomaly is developed with increasing depth
(Figure 7) because of a decrease in Ce coinciding
with increases in La and Pr (or Nd) concentrations.
In the aoxic basins, Ce
4þ is reduced to Ce
3þ and
the Ce-anomaly tends to be smaller than those in
oxygenated waters. The Black Sea provides a best
example in which Ce/Ce * sharply increases from less
4.7
40 ˚ N
0 ˚
20 ˚ N
40 ˚ S
40°N
0°
20°N
20°S
40°S
100 ˚ E
120 ˚ E
140 ˚ E
80 ˚ E
100 ˚ E
120 ˚ E
140 ˚ E
80 ˚ E
18.9
19.6(PA10)
18.4(PA9)
14.5
7.0
7.0
15.5
12.8
11.3
11.8
7.3
8.8
12.4
12.4
13.9(PA11)
11.2
10.6
9.5
+2.8
+3.6
3.2+
3.3+
+
3.1 4.1
4.8
3.1
2.8
9.2(PA1)
6.5
9.0
7.3
13.5
8.7(PA2)
7.1
7.4
5.4 5.9
5.0
5.6
3.8
3.0
4.1
4.8
(PA4)
(A)
(F)
(B)
(G)
(C)
(H)
(D)
(I)
(E)
(in Fig. 9)
4.6
(PA5)
7.4(PA7)
Nd concentration
(pmol kg
_ 1
)
20 ˚ S
12.9
(B)
Figure 2 Continued. (B) The station locations occupied by R. V. Hakuho Maru during the 1996/97 Piscis Austrinus Expedition and
the dissolved (o0.04 mm) Nd concentrations in the surface waters. The different symbols are used according to the different regions
where NPDW-normalized REE patterns are grouped in Figure 9. The stations indicated by PA-numbers show the locations where the
vertical profiles of dissolved REEs were determined.
RARE EARTH ELEMENTS AND THEIR ISOTOPES IN THE OCEAN 43