

(kerogen) contained in weathered sedimentary rocks
is a source of isotopically light carbon for the ocean,
tending to decrease its d
13 C. The recent decrease in
d
13 C since mid-Miocene times might thus be interpreted as the result of kerogen carbon oxidation
being larger than organic carbon burial during that
period. Similarly, the overall constancy of sea water
d
13 C from the middle Eocene to the middle Miocene
may suggest that the organic subcycle was essentially
balanced at that time. However, the average carbon
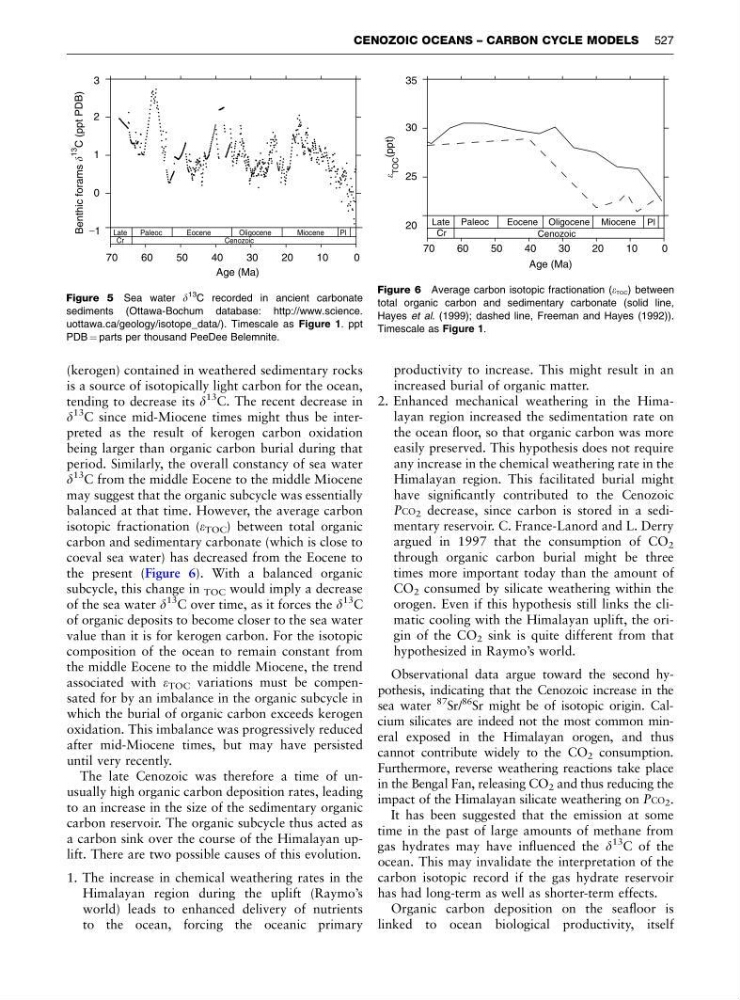
isotopic fractionation (e TOC ) between total organic
carbon and sedimentary carbonate (which is close to
coeval sea water) has decreased from the Eocene to
the present (Figure 6). With a balanced organic
subcycle, this change in TOC would imply a decrease
of the sea water d
13 C over time, as it forces the d
13 C
of organic deposits to become closer to the sea water
value than it is for kerogen carbon. For the isotopic
composition of the ocean to remain constant from
the middle Eocene to the middle Miocene, the trend
associated with e TOC variations must be compensated for by an imbalance in the organic subcycle in
which the burial of organic carbon exceeds kerogen
oxidation. This imbalance was progressively reduced
after mid-Miocene times, but may have persisted
until very recently.
The late Cenozoic was therefore a time of unusually high organic carbon deposition rates, leading
to an increase in the size of the sedimentary organic
carbon reservoir. The organic subcycle thus acted as
a carbon sink over the course of the Himalayan uplift. There are two possible causes of this evolution.
1. The increase in chemical weathering rates in the
Himalayan region during the uplift (Raymo’s
world) leads to enhanced delivery of nutrients
to the ocean, forcing the oceanic primary
productivity to increase. This might result in an
increased burial of organic matter.
2. Enhanced mechanical weathering in the Himalayan region increased the sedimentation rate on
the ocean floor, so that organic carbon was more
easily preserved. This hypothesis does not require
any increase in the chemical weathering rate in the
Himalayan region. This facilitated burial might
have significantly contributed to the Cenozoic
PCO 2 decrease, since carbon is stored in a sedimentary reservoir. C. France-Lanord and L. Derry
argued in 1997 that the consumption of CO 2
through organic carbon burial might be three
times more important today than the amount of
CO 2 consumed by silicate weathering within the
orogen. Even if this hypothesis still links the climatic cooling with the Himalayan uplift, the origin of the CO 2 sink is quite different from that
hypothesized in Raymo’s world.
Observational data argue toward the second hypothesis, indicating that the Cenozoic increase in the
sea water
87
Sr/
86
Sr might be of isotopic origin. Calcium silicates are indeed not the most common mineral exposed in the Himalayan orogen, and thus
cannot contribute widely to the CO 2 consumption.
Furthermore, reverse weathering reactions take place
in the Bengal Fan, releasing CO 2 and thus reducing the
impact of the Himalayan silicate weathering on PCO 2 .
It has been suggested that the emission at some
time in the past of large amounts of methane from
gas hydrates may have influenced the d
13 C of the
ocean. This may invalidate the interpretation of the
carbon isotopic record if the gas hydrate reservoir
has had long-term as well as shorter-term effects.
Organic carbon deposition on the seafloor is
linked to ocean biological productivity, itself
70
60
50
40
30
20
10
0
Age (Ma)
_ 1
0
1
2
3
Benthic
forams
13
C
(ppt
PDB)
Late
Oligocene
Miocene
Paleoc
Eocene
Cenozoic
Pl
Cr
Figure 5 Sea water d
13 C recorded in ancient carbonate
sediments (Ottawa-Bochum database: http://www.science.
uottawa.ca/geology/isotope_data/). Timescale as Figure 1. ppt
PDB ¼ parts per thousand PeeDee Belemnite.
70
60
50
40
30
20
10
0
Age (Ma)
20
25
30
35
TOC
(ppt)
Cr
Cenozoic
Late
Eocene Oligocene Miocene Pl
Paleoc
Figure 6 Average carbon isotopic fractionation (eTOC) between
total organic carbon and sedimentary carbonate (solid line,
Hayes et al. (1999); dashed line, Freeman and Hayes (1992)).
Timescale as Figure 1.
CENOZOIC OCEANS – CARBON CYCLE MODELS 527
is a source of isotopically light carbon for the ocean,
tending to decrease its d
13 C. The recent decrease in
d
13 C since mid-Miocene times might thus be interpreted as the result of kerogen carbon oxidation
being larger than organic carbon burial during that
period. Similarly, the overall constancy of sea water
d
13 C from the middle Eocene to the middle Miocene
may suggest that the organic subcycle was essentially
balanced at that time. However, the average carbon
isotopic fractionation (e TOC ) between total organic
carbon and sedimentary carbonate (which is close to
coeval sea water) has decreased from the Eocene to
the present (Figure 6). With a balanced organic
subcycle, this change in TOC would imply a decrease
of the sea water d
13 C over time, as it forces the d
13 C
of organic deposits to become closer to the sea water
value than it is for kerogen carbon. For the isotopic
composition of the ocean to remain constant from
the middle Eocene to the middle Miocene, the trend
associated with e TOC variations must be compensated for by an imbalance in the organic subcycle in
which the burial of organic carbon exceeds kerogen
oxidation. This imbalance was progressively reduced
after mid-Miocene times, but may have persisted
until very recently.
The late Cenozoic was therefore a time of unusually high organic carbon deposition rates, leading
to an increase in the size of the sedimentary organic
carbon reservoir. The organic subcycle thus acted as
a carbon sink over the course of the Himalayan uplift. There are two possible causes of this evolution.
1. The increase in chemical weathering rates in the
Himalayan region during the uplift (Raymo’s
world) leads to enhanced delivery of nutrients
to the ocean, forcing the oceanic primary
productivity to increase. This might result in an
increased burial of organic matter.
2. Enhanced mechanical weathering in the Himalayan region increased the sedimentation rate on
the ocean floor, so that organic carbon was more
easily preserved. This hypothesis does not require
any increase in the chemical weathering rate in the
Himalayan region. This facilitated burial might
have significantly contributed to the Cenozoic
PCO 2 decrease, since carbon is stored in a sedimentary reservoir. C. France-Lanord and L. Derry
argued in 1997 that the consumption of CO 2
through organic carbon burial might be three
times more important today than the amount of
CO 2 consumed by silicate weathering within the
orogen. Even if this hypothesis still links the climatic cooling with the Himalayan uplift, the origin of the CO 2 sink is quite different from that
hypothesized in Raymo’s world.
Observational data argue toward the second hypothesis, indicating that the Cenozoic increase in the
sea water
87
Sr/
86
Sr might be of isotopic origin. Calcium silicates are indeed not the most common mineral exposed in the Himalayan orogen, and thus
cannot contribute widely to the CO 2 consumption.
Furthermore, reverse weathering reactions take place
in the Bengal Fan, releasing CO 2 and thus reducing the
impact of the Himalayan silicate weathering on PCO 2 .
It has been suggested that the emission at some
time in the past of large amounts of methane from
gas hydrates may have influenced the d
13 C of the
ocean. This may invalidate the interpretation of the
carbon isotopic record if the gas hydrate reservoir
has had long-term as well as shorter-term effects.
Organic carbon deposition on the seafloor is
linked to ocean biological productivity, itself
70
60
50
40
30
20
10
0
Age (Ma)
_ 1
0
1
2
3
Benthic
forams
13
C
(ppt
PDB)
Late
Oligocene
Miocene
Paleoc
Eocene
Cenozoic
Pl
Cr
Figure 5 Sea water d
13 C recorded in ancient carbonate
sediments (Ottawa-Bochum database: http://www.science.
uottawa.ca/geology/isotope_data/). Timescale as Figure 1. ppt
PDB ¼ parts per thousand PeeDee Belemnite.
70
60
50
40
30
20
10
0
Age (Ma)
20
25
30
35
TOC
(ppt)
Cr
Cenozoic
Late
Eocene Oligocene Miocene Pl
Paleoc
Figure 6 Average carbon isotopic fractionation (eTOC) between
total organic carbon and sedimentary carbonate (solid line,
Hayes et al. (1999); dashed line, Freeman and Hayes (1992)).
Timescale as Figure 1.
CENOZOIC OCEANS – CARBON CYCLE MODELS 527