

interest. Raymo’s world has the ability to exhaust
atmospheric CO 2 within a few million years.
In an attempt to reconcile the two approaches,
Franc¸ ois and Walker proposed in 1992 the addition
of a new CO 2 consumption flux to the carbon cycle,
identified as the precipitation of abiotic carbonates
within the oceanic crust, subsequent to its alteration
at low temperature. This flux is directly dependent
on deep water temperature, which has decreased by
B81C over the Cenozoic. An increase in the continental weathering rate might be compatible with a
constant degassing rate, since the sink of carbon
through low-temperature alteration of the oceanic
crust is decreasing. The balance between input and
output is thus still in place. However, this additional
sink of carbon is poorly constrained. The present-day
consumption of carbon is estimated to be about
1.4 Â 10
12 mol y
À1
, but the kinetics of the process is
essentially unknown. This attractive hypothesis still
needs experimental verification.
Finally, it should be noted that Raymo’s hypothesis
interprets the increase in the sea water
87 Sr/
86 Sr in
terms of an increase in the weathering fluxes. However, silicate minerals exposed in the Himalayan
area, particularly in the High Himalayan Crystalline
Series, display unusually high isotopic ratios (reaching 0.740). Sediments of Proterozoic age with a
87 Sr/
86 Sr reaching 0.8 are also exposed in the Lesser
Himalaya area. For this reason, rivers draining the
Himalayan area (Ganges, Brahmapoutra, etc.) display an isotopic ratio (0.725 for the Ganges) higher
than the mean global value (0.712). At least part of
the Cenozoic increase in the sea water
87 Sr/
86 Sr
might thus be due to changes in the isotopic composition of source rocks.
Lysocline and Carbonate Accumulation Changes
Other indicators of a possible increase in the continental weathering rate over the course of Cenozoic
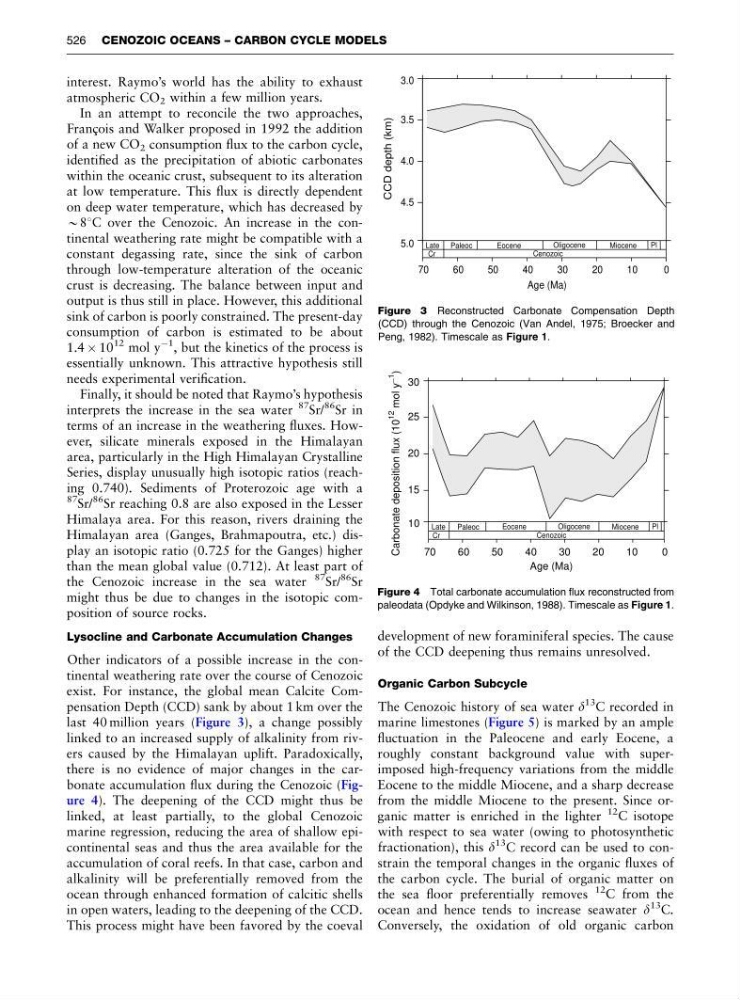
exist. For instance, the global mean Calcite Compensation Depth (CCD) sank by about 1 km over the
last 40 million years (Figure 3), a change possibly
linked to an increased supply of alkalinity from rivers caused by the Himalayan uplift. Paradoxically,
there is no evidence of major changes in the carbonate accumulation flux during the Cenozoic (Figure 4). The deepening of the CCD might thus be
linked, at least partially, to the global Cenozoic
marine regression, reducing the area of shallow epicontinental seas and thus the area available for the
accumulation of coral reefs. In that case, carbon and
alkalinity will be preferentially removed from the
ocean through enhanced formation of calcitic shells
in open waters, leading to the deepening of the CCD.
This process might have been favored by the coeval
development of new foraminiferal species. The cause
of the CCD deepening thus remains unresolved.
Organic Carbon Subcycle
The Cenozoic history of sea water d
13 C recorded in
marine limestones (Figure 5) is marked by an ample
fluctuation in the Paleocene and early Eocene, a
roughly constant background value with superimposed high-frequency variations from the middle
Eocene to the middle Miocene, and a sharp decrease
from the middle Miocene to the present. Since organic matter is enriched in the lighter
12 C isotope
with respect to sea water (owing to photosynthetic
fractionation), this d
13 C record can be used to constrain the temporal changes in the organic fluxes of
the carbon cycle. The burial of organic matter on
the sea floor preferentially removes
12
C from the
ocean and hence tends to increase seawater d
13
C.
Conversely, the oxidation of old organic carbon
70
60
50
40
30
20
10
0
Age (Ma)
5.0
4.5
4.0
3.5
3.0
CCD depth (km)
Cr
Cenozoic
Late
Oligocene
Miocene
Paleoc
Eocene
Pl
Figure 3 Reconstructed Carbonate Compensation Depth
(CCD) through the Cenozoic (Van Andel, 1975; Broecker and
Peng, 1982). Timescale as Figure 1.
70
60
50
40
30
20
10
0
Age (Ma)
10
15
20
25
30
Carbonate deposition flux (10
12
mol y
_
1
)
Cr
Cenozoic
Late
Oligocene
Miocene
Paleoc
Eocene
Pl
Figure 4 Total carbonate accumulation flux reconstructed from
paleodata (Opdyke and Wilkinson, 1988). Timescale as Figure 1.
526 CENOZOIC OCEANS – CARBON CYCLE MODELS
atmospheric CO 2 within a few million years.
In an attempt to reconcile the two approaches,
Franc¸ ois and Walker proposed in 1992 the addition
of a new CO 2 consumption flux to the carbon cycle,
identified as the precipitation of abiotic carbonates
within the oceanic crust, subsequent to its alteration
at low temperature. This flux is directly dependent
on deep water temperature, which has decreased by
B81C over the Cenozoic. An increase in the continental weathering rate might be compatible with a
constant degassing rate, since the sink of carbon
through low-temperature alteration of the oceanic
crust is decreasing. The balance between input and
output is thus still in place. However, this additional
sink of carbon is poorly constrained. The present-day
consumption of carbon is estimated to be about
1.4 Â 10
12 mol y
À1
, but the kinetics of the process is
essentially unknown. This attractive hypothesis still
needs experimental verification.
Finally, it should be noted that Raymo’s hypothesis
interprets the increase in the sea water
87 Sr/
86 Sr in
terms of an increase in the weathering fluxes. However, silicate minerals exposed in the Himalayan
area, particularly in the High Himalayan Crystalline
Series, display unusually high isotopic ratios (reaching 0.740). Sediments of Proterozoic age with a
87 Sr/
86 Sr reaching 0.8 are also exposed in the Lesser
Himalaya area. For this reason, rivers draining the
Himalayan area (Ganges, Brahmapoutra, etc.) display an isotopic ratio (0.725 for the Ganges) higher
than the mean global value (0.712). At least part of
the Cenozoic increase in the sea water
87 Sr/
86 Sr
might thus be due to changes in the isotopic composition of source rocks.
Lysocline and Carbonate Accumulation Changes
Other indicators of a possible increase in the continental weathering rate over the course of Cenozoic
exist. For instance, the global mean Calcite Compensation Depth (CCD) sank by about 1 km over the
last 40 million years (Figure 3), a change possibly
linked to an increased supply of alkalinity from rivers caused by the Himalayan uplift. Paradoxically,
there is no evidence of major changes in the carbonate accumulation flux during the Cenozoic (Figure 4). The deepening of the CCD might thus be
linked, at least partially, to the global Cenozoic
marine regression, reducing the area of shallow epicontinental seas and thus the area available for the
accumulation of coral reefs. In that case, carbon and
alkalinity will be preferentially removed from the
ocean through enhanced formation of calcitic shells
in open waters, leading to the deepening of the CCD.
This process might have been favored by the coeval
development of new foraminiferal species. The cause
of the CCD deepening thus remains unresolved.
Organic Carbon Subcycle
The Cenozoic history of sea water d
13 C recorded in
marine limestones (Figure 5) is marked by an ample
fluctuation in the Paleocene and early Eocene, a
roughly constant background value with superimposed high-frequency variations from the middle
Eocene to the middle Miocene, and a sharp decrease
from the middle Miocene to the present. Since organic matter is enriched in the lighter
12 C isotope
with respect to sea water (owing to photosynthetic
fractionation), this d
13 C record can be used to constrain the temporal changes in the organic fluxes of
the carbon cycle. The burial of organic matter on
the sea floor preferentially removes
12
C from the
ocean and hence tends to increase seawater d
13
C.
Conversely, the oxidation of old organic carbon
70
60
50
40
30
20
10
0
Age (Ma)
5.0
4.5
4.0
3.5
3.0
CCD depth (km)
Cr
Cenozoic
Late
Oligocene
Miocene
Paleoc
Eocene
Pl
Figure 3 Reconstructed Carbonate Compensation Depth
(CCD) through the Cenozoic (Van Andel, 1975; Broecker and
Peng, 1982). Timescale as Figure 1.
70
60
50
40
30
20
10
0
Age (Ma)
10
15
20
25
30
Carbonate deposition flux (10
12
mol y
_
1
)
Cr
Cenozoic
Late
Oligocene
Miocene
Paleoc
Eocene
Pl
Figure 4 Total carbonate accumulation flux reconstructed from
paleodata (Opdyke and Wilkinson, 1988). Timescale as Figure 1.
526 CENOZOIC OCEANS – CARBON CYCLE MODELS