

rates. These tracers are the major focus here. The
distribution of other tracer species is more closely
governed by biology and chemistry, for example, the
thorium isotope series, which is used to study export
production, particle scavenging, vertical transport,
and remineralization rates.
Ocean Tracers and Dynamics: A Onedimensional (1-D) Example
Natural radiocarbon (
14 C), a radioactive isotope of
carbon, is a prototypical example of a (mostly) passive ocean circulation tracer. Radiocarbon is produced by cosmic rays in the upper atmosphere and
enters the surface ocean as radiolabeled carbon dioxide (
14 CO 2 ) via air–sea gas exchange. The
14 C DIC
concentrations in the ocean decrease away from the
surface, reflecting the passage of time since the water
was last exposed to the atmosphere. Some radiolabeled carbon is transported to the deep ocean in
sinking particulate organic matter, which can be
largely corrected for in the analysis. The
14
C deficits
relative to the surface water can be converted into
age estimates for ocean deep waters using the
radioactive decay half-life (5730 years). Natural
radiocarbon is most effective for describing the slow
thermohaline overturning circulation of the deep
ocean, which has timescales of roughly a few hundred to a thousand years.
The main thermocline of the ocean, from the surface down to about 1 km or so, has more rapid
ventilation timescales, from a few years to a few
decades. Tracers useful in this regard are chlorofluorocarbons, tritium and its decay product
3
He,
and bomb radiocarbon, which along with tritium
was released into the atmosphere in large quantities
in the 1950s and 1960s by atmospheric nuclear
weapons testing.
When properly formulated, the combination of
ocean process tracers and numerical models provides
powerful tools for studying ocean biogeochemistry.
At their most basic level, models are simply a
mathematical statement quantifying the rates of the
essential physical and biogeochemical processes. For
example, advection–diffusion models are structured
around coupled sets of differential equations:
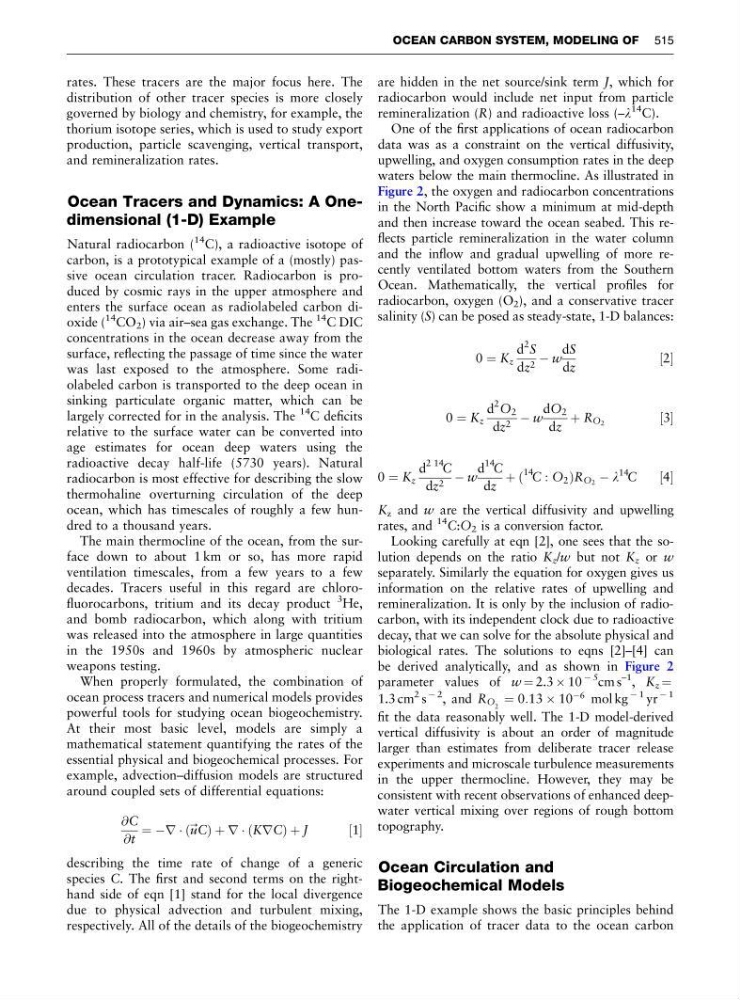
@C
@t
¼ Àr Á ð
-
uCÞ þ r Á ðKrCÞ þ J
½1
describing the time rate of change of a generic
species C. The first and second terms on the righthand side of eqn [1] stand for the local divergence
due to physical advection and turbulent mixing,
respectively. All of the details of the biogeochemistry
are hidden in the net source/sink term J, which for
radiocarbon would include net input from particle
remineralization (R) and radioactive loss (–l
14 C).
One of the first applications of ocean radiocarbon
data was as a constraint on the vertical diffusivity,
upwelling, and oxygen consumption rates in the deep
waters below the main thermocline. As illustrated in
Figure 2, the oxygen and radiocarbon concentrations
in the North Pacific show a minimum at mid-depth
and then increase toward the ocean seabed. This reflects particle remineralization in the water column
and the inflow and gradual upwelling of more recently ventilated bottom waters from the Southern
Ocean. Mathematically, the vertical profiles for
radiocarbon, oxygen (O 2 ), and a conservative tracer
salinity (S) can be posed as steady-state, 1-D balances:
0 ¼ K z
d
2 S
dz 2 À w
dS
dz
½2
0 ¼ K z
d
2 O 2
dz 2 À w
dO 2
dz
þ R O 2
½3
0 ¼ K z
d
2 14
C
dz 2 À w
d
14
C
dz
þ ð
14
C : O 2 ÞR O2 À l
14
C
½4
K z and w are the vertical diffusivity and upwelling
rates, and
14
C:O 2 is a conversion factor.
Looking carefully at eqn [2], one sees that the solution depends on the ratio K z /w but not K z or w
separately. Similarly the equation for oxygen gives us
information on the relative rates of upwelling and
remineralization. It is only by the inclusion of radiocarbon, with its independent clock due to radioactive
decay, that we can solve for the absolute physical and
biological rates. The solutions to eqns [2]–[4] can
be derived analytically, and as shown in Figure 2
parameter values of w ¼ 2.3 Â 10
À 5
cm s
–1
, K z ¼
1.3 cm
2 s
À 2
, and R O 2 ¼ 0:13 Â 10
À6 mol kg
À 1 yr
À 1
fit the data reasonably well. The 1-D model-derived
vertical diffusivity is about an order of magnitude
larger than estimates from deliberate tracer release
experiments and microscale turbulence measurements
in the upper thermocline. However, they may be
consistent with recent observations of enhanced deepwater vertical mixing over regions of rough bottom
topography.
Ocean Circulation and
Biogeochemical Models
The 1-D example shows the basic principles behind
the application of tracer data to the ocean carbon
OCEAN CARBON SYSTEM, MODELING OF 515
distribution of other tracer species is more closely
governed by biology and chemistry, for example, the
thorium isotope series, which is used to study export
production, particle scavenging, vertical transport,
and remineralization rates.
Ocean Tracers and Dynamics: A Onedimensional (1-D) Example
Natural radiocarbon (
14 C), a radioactive isotope of
carbon, is a prototypical example of a (mostly) passive ocean circulation tracer. Radiocarbon is produced by cosmic rays in the upper atmosphere and
enters the surface ocean as radiolabeled carbon dioxide (
14 CO 2 ) via air–sea gas exchange. The
14 C DIC
concentrations in the ocean decrease away from the
surface, reflecting the passage of time since the water
was last exposed to the atmosphere. Some radiolabeled carbon is transported to the deep ocean in
sinking particulate organic matter, which can be
largely corrected for in the analysis. The
14
C deficits
relative to the surface water can be converted into
age estimates for ocean deep waters using the
radioactive decay half-life (5730 years). Natural
radiocarbon is most effective for describing the slow
thermohaline overturning circulation of the deep
ocean, which has timescales of roughly a few hundred to a thousand years.
The main thermocline of the ocean, from the surface down to about 1 km or so, has more rapid
ventilation timescales, from a few years to a few
decades. Tracers useful in this regard are chlorofluorocarbons, tritium and its decay product
3
He,
and bomb radiocarbon, which along with tritium
was released into the atmosphere in large quantities
in the 1950s and 1960s by atmospheric nuclear
weapons testing.
When properly formulated, the combination of
ocean process tracers and numerical models provides
powerful tools for studying ocean biogeochemistry.
At their most basic level, models are simply a
mathematical statement quantifying the rates of the
essential physical and biogeochemical processes. For
example, advection–diffusion models are structured
around coupled sets of differential equations:
@C
@t
¼ Àr Á ð
-
uCÞ þ r Á ðKrCÞ þ J
½1
describing the time rate of change of a generic
species C. The first and second terms on the righthand side of eqn [1] stand for the local divergence
due to physical advection and turbulent mixing,
respectively. All of the details of the biogeochemistry
are hidden in the net source/sink term J, which for
radiocarbon would include net input from particle
remineralization (R) and radioactive loss (–l
14 C).
One of the first applications of ocean radiocarbon
data was as a constraint on the vertical diffusivity,
upwelling, and oxygen consumption rates in the deep
waters below the main thermocline. As illustrated in
Figure 2, the oxygen and radiocarbon concentrations
in the North Pacific show a minimum at mid-depth
and then increase toward the ocean seabed. This reflects particle remineralization in the water column
and the inflow and gradual upwelling of more recently ventilated bottom waters from the Southern
Ocean. Mathematically, the vertical profiles for
radiocarbon, oxygen (O 2 ), and a conservative tracer
salinity (S) can be posed as steady-state, 1-D balances:
0 ¼ K z
d
2 S
dz 2 À w
dS
dz
½2
0 ¼ K z
d
2 O 2
dz 2 À w
dO 2
dz
þ R O 2
½3
0 ¼ K z
d
2 14
C
dz 2 À w
d
14
C
dz
þ ð
14
C : O 2 ÞR O2 À l
14
C
½4
K z and w are the vertical diffusivity and upwelling
rates, and
14
C:O 2 is a conversion factor.
Looking carefully at eqn [2], one sees that the solution depends on the ratio K z /w but not K z or w
separately. Similarly the equation for oxygen gives us
information on the relative rates of upwelling and
remineralization. It is only by the inclusion of radiocarbon, with its independent clock due to radioactive
decay, that we can solve for the absolute physical and
biological rates. The solutions to eqns [2]–[4] can
be derived analytically, and as shown in Figure 2
parameter values of w ¼ 2.3 Â 10
À 5
cm s
–1
, K z ¼
1.3 cm
2 s
À 2
, and R O 2 ¼ 0:13 Â 10
À6 mol kg
À 1 yr
À 1
fit the data reasonably well. The 1-D model-derived
vertical diffusivity is about an order of magnitude
larger than estimates from deliberate tracer release
experiments and microscale turbulence measurements
in the upper thermocline. However, they may be
consistent with recent observations of enhanced deepwater vertical mixing over regions of rough bottom
topography.
Ocean Circulation and
Biogeochemical Models
The 1-D example shows the basic principles behind
the application of tracer data to the ocean carbon
OCEAN CARBON SYSTEM, MODELING OF 515