

water, a process termed respiration or remineralization. The export flux from the surface ocean is a key
factor driving the marine biogeochemical cycles of
carbon, oxygen, nitrogen, phosphorus, silicon, and
trace metals such as iron.
The surface export and subsurface remineralization
of organic matter are difficult to measure directly.
Biogeochemical rates, therefore, are often inferred
based on the large-scale distributions of DIC, alkalinity, inorganic nutrients (nitrate, phosphate, and
silicate), and dissolved oxygen. The elemental stoichiometry of marine organic matter, referred to as the
Redfield ratio, is with some interesting exceptions
relatively constant in the ocean, simplifying the problem of interrelating the various biogeochemical fields.
Geochemical distributions have the advantage that
they integrate over much of the localized time/space
variability in the ocean and can be used to extrapolate
to region and basin scales. Property fields, though,
reflect a combination of the net biogeochemical uptake
and release as well as physical circulation and turbulent mixing. Additional information is required to
separate these signals and can come from a mix of
dynamical constraints, numerical models, and ocean
process tracers.
The latter two approaches are related because
natural and artificial tracers are used to calibrate or
evaluate ocean models. A key aspect of these tracers
is that they provide independent information on
timescale, either because they decay or are produced
at some known rate, for example, due to radioactivity, or because they are released into the ocean
with a known time history. The different chemical
tracers can be roughly divided into two classes. Circulation tracers such as radiocarbon, tritium–
3
He,
and the chlorofluorocarbons are not strongly impacted by biogeochemical cycling and are used primarily to quantify physical advection and mixing
Atmosphere
750
Fossil fuels
and cement
production
Surface ocean
1020
Vegetation 610
Soils and detritus 1580
2190
Marine biota
3
R iv er s
E
ro
si
on
DOC
<700
Intermediate
and deep ocean
38 100
Surface sediment
150
1.6
0.5
92
0.8
40 50
100
2
2
0.2
8
91.6
50
51.4
90.6
5.5
W e
a t h e r in g
C h a n g i n g
l a n d
u s e
G l o b a l n e t p r i m
a r y p r o d u c t i o n
a n d
r e s p i r a t i o n
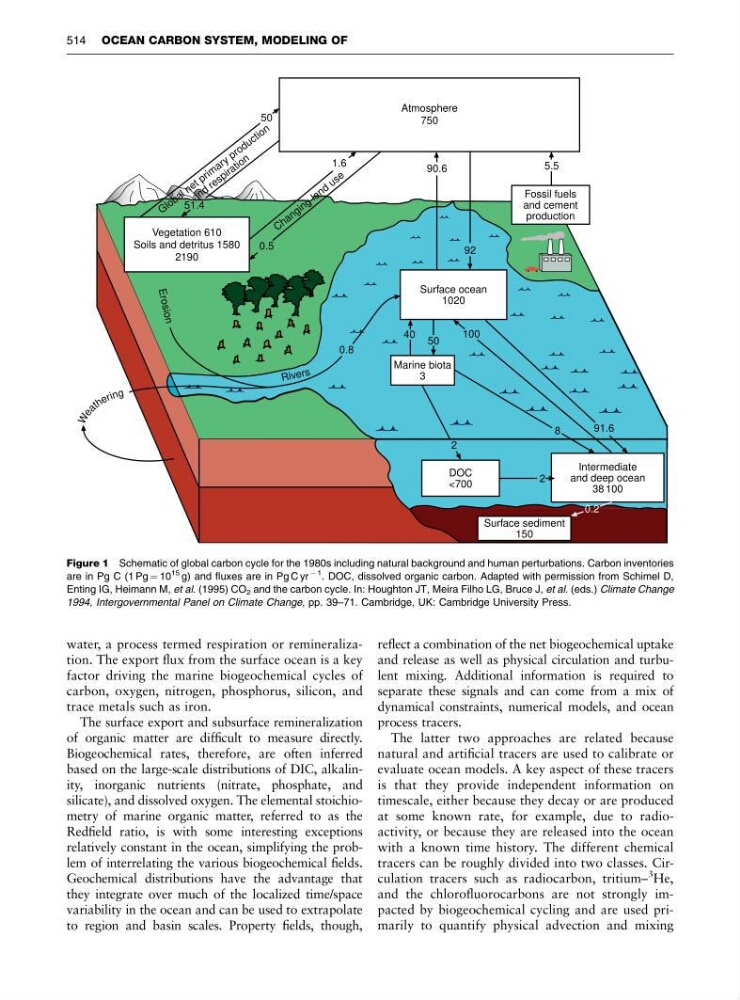
Figure 1 Schematic of global carbon cycle for the 1980s including natural background and human perturbations. Carbon inventories
are in Pg C (1 Pg ¼ 10
15 g) and fluxes are in Pg C yr
À 1
. DOC, dissolved organic carbon. Adapted with permission from Schimel D,
Enting IG, Heimann M, et al. (1995) CO 2 and the carbon cycle. In: Houghton JT, Meira Filho LG, Bruce J, et al. (eds.) Climate Change
1994, Intergovernmental Panel on Climate Change, pp. 39–71. Cambridge, UK: Cambridge University Press.
514 OCEAN CARBON SYSTEM, MODELING OF
factor driving the marine biogeochemical cycles of
carbon, oxygen, nitrogen, phosphorus, silicon, and
trace metals such as iron.
The surface export and subsurface remineralization
of organic matter are difficult to measure directly.
Biogeochemical rates, therefore, are often inferred
based on the large-scale distributions of DIC, alkalinity, inorganic nutrients (nitrate, phosphate, and
silicate), and dissolved oxygen. The elemental stoichiometry of marine organic matter, referred to as the
Redfield ratio, is with some interesting exceptions
relatively constant in the ocean, simplifying the problem of interrelating the various biogeochemical fields.
Geochemical distributions have the advantage that
they integrate over much of the localized time/space
variability in the ocean and can be used to extrapolate
to region and basin scales. Property fields, though,
reflect a combination of the net biogeochemical uptake
and release as well as physical circulation and turbulent mixing. Additional information is required to
separate these signals and can come from a mix of
dynamical constraints, numerical models, and ocean
process tracers.
The latter two approaches are related because
natural and artificial tracers are used to calibrate or
evaluate ocean models. A key aspect of these tracers
is that they provide independent information on
timescale, either because they decay or are produced
at some known rate, for example, due to radioactivity, or because they are released into the ocean
with a known time history. The different chemical
tracers can be roughly divided into two classes. Circulation tracers such as radiocarbon, tritium–
3
He,
and the chlorofluorocarbons are not strongly impacted by biogeochemical cycling and are used primarily to quantify physical advection and mixing
Atmosphere
750
Fossil fuels
and cement
production
Surface ocean
1020
Vegetation 610
Soils and detritus 1580
2190
Marine biota
3
R iv er s
E
ro
si
on
DOC
<700
Intermediate
and deep ocean
38 100
Surface sediment
150
1.6
0.5
92
0.8
40 50
100
2
2
0.2
8
91.6
50
51.4
90.6
5.5
W e
a t h e r in g
C h a n g i n g
l a n d
u s e
G l o b a l n e t p r i m
a r y p r o d u c t i o n
a n d
r e s p i r a t i o n
Figure 1 Schematic of global carbon cycle for the 1980s including natural background and human perturbations. Carbon inventories
are in Pg C (1 Pg ¼ 10
15 g) and fluxes are in Pg C yr
À 1
. DOC, dissolved organic carbon. Adapted with permission from Schimel D,
Enting IG, Heimann M, et al. (1995) CO 2 and the carbon cycle. In: Houghton JT, Meira Filho LG, Bruce J, et al. (eds.) Climate Change
1994, Intergovernmental Panel on Climate Change, pp. 39–71. Cambridge, UK: Cambridge University Press.
514 OCEAN CARBON SYSTEM, MODELING OF