

responsible for the large uptake by the Southern
Ocean.
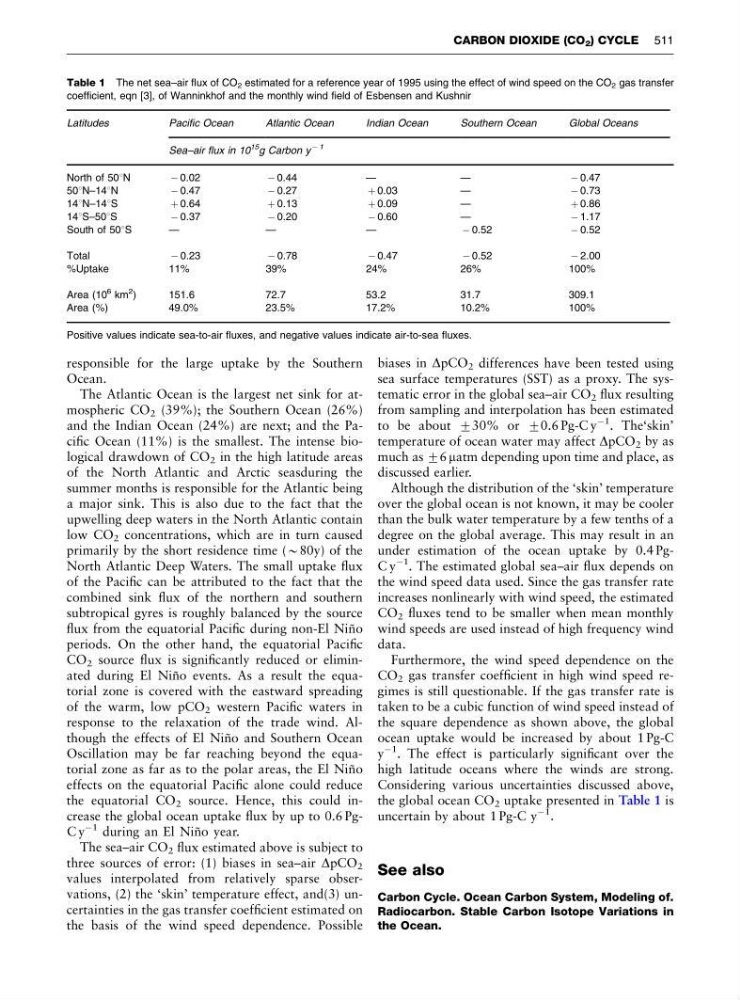
The Atlantic Ocean is the largest net sink for atmospheric CO 2 (39%); the Southern Ocean (26%)
and the Indian Ocean (24%) are next; and the Pacific Ocean (11%) is the smallest. The intense biological drawdown of CO 2 in the high latitude areas
of the North Atlantic and Arctic seasduring the
summer months is responsible for the Atlantic being
a major sink. This is also due to the fact that the
upwelling deep waters in the North Atlantic contain
low CO 2 concentrations, which are in turn caused
primarily by the short residence time (B80y) of the
North Atlantic Deep Waters. The small uptake flux
of the Pacific can be attributed to the fact that the
combined sink flux of the northern and southern
subtropical gyres is roughly balanced by the source
flux from the equatorial Pacific during non-El Nin ˜ o
periods. On the other hand, the equatorial Pacific
CO 2 source flux is significantly reduced or eliminated during El Nin ˜ o events. As a result the equatorial zone is covered with the eastward spreading
of the warm, low pCO 2 western Pacific waters in
response to the relaxation of the trade wind. Although the effects of El Nin ˜ o and Southern Ocean
Oscillation may be far reaching beyond the equatorial zone as far as to the polar areas, the El Nin ˜ o
effects on the equatorial Pacific alone could reduce
the equatorial CO 2 source. Hence, this could increase the global ocean uptake flux by up to 0.6 PgC y
À1 during an El Nin ˜ o year.
The sea–air CO 2 flux estimated above is subject to
three sources of error: (1) biases in sea–air DpCO 2
values interpolated from relatively sparse observations, (2) the ‘skin’ temperature effect, and(3) uncertainties in the gas transfer coefficient estimated on
the basis of the wind speed dependence. Possible
biases in DpCO 2 differences have been tested using
sea surface temperatures (SST) as a proxy. The systematic error in the global sea–air CO 2 flux resulting
from sampling and interpolation has been estimated
to be about 730% or 70.6 Pg-C y
À1
. The‘skin’
temperature of ocean water may affect DpCO 2 by as
much as 76 matm depending upon time and place, as
discussed earlier.
Although the distribution of the ‘skin’ temperature
over the global ocean is not known, it may be cooler
than the bulk water temperature by a few tenths of a
degree on the global average. This may result in an
under estimation of the ocean uptake by 0.4 PgC y
À1
. The estimated global sea–air flux depends on
the wind speed data used. Since the gas transfer rate
increases nonlinearly with wind speed, the estimated
CO 2 fluxes tend to be smaller when mean monthly
wind speeds are used instead of high frequency wind
data.
Furthermore, the wind speed dependence on the
CO 2 gas transfer coefficient in high wind speed regimes is still questionable. If the gas transfer rate is
taken to be a cubic function of wind speed instead of
the square dependence as shown above, the global
ocean uptake would be increased by about 1 Pg-C
y
À1
. The effect is particularly significant over the
high latitude oceans where the winds are strong.
Considering various uncertainties discussed above,
the global ocean CO 2 uptake presented in Table 1 is
uncertain by about 1 Pg-C y
À1
.
See also
Carbon Cycle. Ocean Carbon System, Modeling of.
Radiocarbon. Stable Carbon Isotope Variations in
the Ocean.
Table 1 The net sea–air flux of CO 2 estimated for a reference year of 1995 using the effect of wind speed on the CO 2 gas transfer
coefficient, eqn [3], of Wanninkhof and the monthly wind field of Esbensen and Kushnir
Latitudes
Pacific Ocean
Atlantic Ocean
Indian Ocean
Southern Ocean
Global Oceans
Sea–air flux in 10
15 g Carbon y
À 1
North of 501N
À 0.02
À 0.44
—
—
À 0.47
501N–141N
À 0.47
À 0.27
þ 0.03
—
À 0.73
141N–141S
þ 0.64
þ 0.13
þ 0.09
—
þ 0.86
141S–501S
À 0.37
À 0.20
À 0.60
—
À 1.17
South of 501S
—
—
—
À 0.52
À 0.52
Total
À 0.23
À 0.78
À 0.47
À 0.52
À 2.00
%Uptake
11%
39%
24%
26%
100%
Area (10
6 km
2 )
151.6
72.7
53.2
31.7
309.1
Area (%)
49.0%
23.5%
17.2%
10.2%
100%
Positive values indicate sea-to-air fluxes, and negative values indicate air-to-sea fluxes.
CARBON DIOXIDE (CO 2 ) CYCLE 511
Ocean.
The Atlantic Ocean is the largest net sink for atmospheric CO 2 (39%); the Southern Ocean (26%)
and the Indian Ocean (24%) are next; and the Pacific Ocean (11%) is the smallest. The intense biological drawdown of CO 2 in the high latitude areas
of the North Atlantic and Arctic seasduring the
summer months is responsible for the Atlantic being
a major sink. This is also due to the fact that the
upwelling deep waters in the North Atlantic contain
low CO 2 concentrations, which are in turn caused
primarily by the short residence time (B80y) of the
North Atlantic Deep Waters. The small uptake flux
of the Pacific can be attributed to the fact that the
combined sink flux of the northern and southern
subtropical gyres is roughly balanced by the source
flux from the equatorial Pacific during non-El Nin ˜ o
periods. On the other hand, the equatorial Pacific
CO 2 source flux is significantly reduced or eliminated during El Nin ˜ o events. As a result the equatorial zone is covered with the eastward spreading
of the warm, low pCO 2 western Pacific waters in
response to the relaxation of the trade wind. Although the effects of El Nin ˜ o and Southern Ocean
Oscillation may be far reaching beyond the equatorial zone as far as to the polar areas, the El Nin ˜ o
effects on the equatorial Pacific alone could reduce
the equatorial CO 2 source. Hence, this could increase the global ocean uptake flux by up to 0.6 PgC y
À1 during an El Nin ˜ o year.
The sea–air CO 2 flux estimated above is subject to
three sources of error: (1) biases in sea–air DpCO 2
values interpolated from relatively sparse observations, (2) the ‘skin’ temperature effect, and(3) uncertainties in the gas transfer coefficient estimated on
the basis of the wind speed dependence. Possible
biases in DpCO 2 differences have been tested using
sea surface temperatures (SST) as a proxy. The systematic error in the global sea–air CO 2 flux resulting
from sampling and interpolation has been estimated
to be about 730% or 70.6 Pg-C y
À1
. The‘skin’
temperature of ocean water may affect DpCO 2 by as
much as 76 matm depending upon time and place, as
discussed earlier.
Although the distribution of the ‘skin’ temperature
over the global ocean is not known, it may be cooler
than the bulk water temperature by a few tenths of a
degree on the global average. This may result in an
under estimation of the ocean uptake by 0.4 PgC y
À1
. The estimated global sea–air flux depends on
the wind speed data used. Since the gas transfer rate
increases nonlinearly with wind speed, the estimated
CO 2 fluxes tend to be smaller when mean monthly
wind speeds are used instead of high frequency wind
data.
Furthermore, the wind speed dependence on the
CO 2 gas transfer coefficient in high wind speed regimes is still questionable. If the gas transfer rate is
taken to be a cubic function of wind speed instead of
the square dependence as shown above, the global
ocean uptake would be increased by about 1 Pg-C
y
À1
. The effect is particularly significant over the
high latitude oceans where the winds are strong.
Considering various uncertainties discussed above,
the global ocean CO 2 uptake presented in Table 1 is
uncertain by about 1 Pg-C y
À1
.
See also
Carbon Cycle. Ocean Carbon System, Modeling of.
Radiocarbon. Stable Carbon Isotope Variations in
the Ocean.
Table 1 The net sea–air flux of CO 2 estimated for a reference year of 1995 using the effect of wind speed on the CO 2 gas transfer
coefficient, eqn [3], of Wanninkhof and the monthly wind field of Esbensen and Kushnir
Latitudes
Pacific Ocean
Atlantic Ocean
Indian Ocean
Southern Ocean
Global Oceans
Sea–air flux in 10
15 g Carbon y
À 1
North of 501N
À 0.02
À 0.44
—
—
À 0.47
501N–141N
À 0.47
À 0.27
þ 0.03
—
À 0.73
141N–141S
þ 0.64
þ 0.13
þ 0.09
—
þ 0.86
141S–501S
À 0.37
À 0.20
À 0.60
—
À 1.17
South of 501S
—
—
—
À 0.52
À 0.52
Total
À 0.23
À 0.78
À 0.47
À 0.52
À 2.00
%Uptake
11%
39%
24%
26%
100%
Area (10
6 km
2 )
151.6
72.7
53.2
31.7
309.1
Area (%)
49.0%
23.5%
17.2%
10.2%
100%
Positive values indicate sea-to-air fluxes, and negative values indicate air-to-sea fluxes.
CARBON DIOXIDE (CO 2 ) CYCLE 511