

the following set of information. (1) The monthly
mean DpCO 2 values in 41 Â 51 pixel areas for the
reference year 1995 (Figure 1A and B for all other
months); (2) the Wanninkhof formulation, eqn [3],
for the effect of wind speed on the CO 2 gas transfer
coefficient; and (3) the climatological mean wind
speeds for each month compiled by Esbensen and
Kushnir in 1981. This set yields a mean global gas
transfer rate of 0.063 mole CO 2 m
À2 matm
À1 y
À1
,
that is consistent with 20 moles CO 2 m
À2
y
À1 estimated on the basis of carbon-14 distribution in the
atmosphere and the oceans.
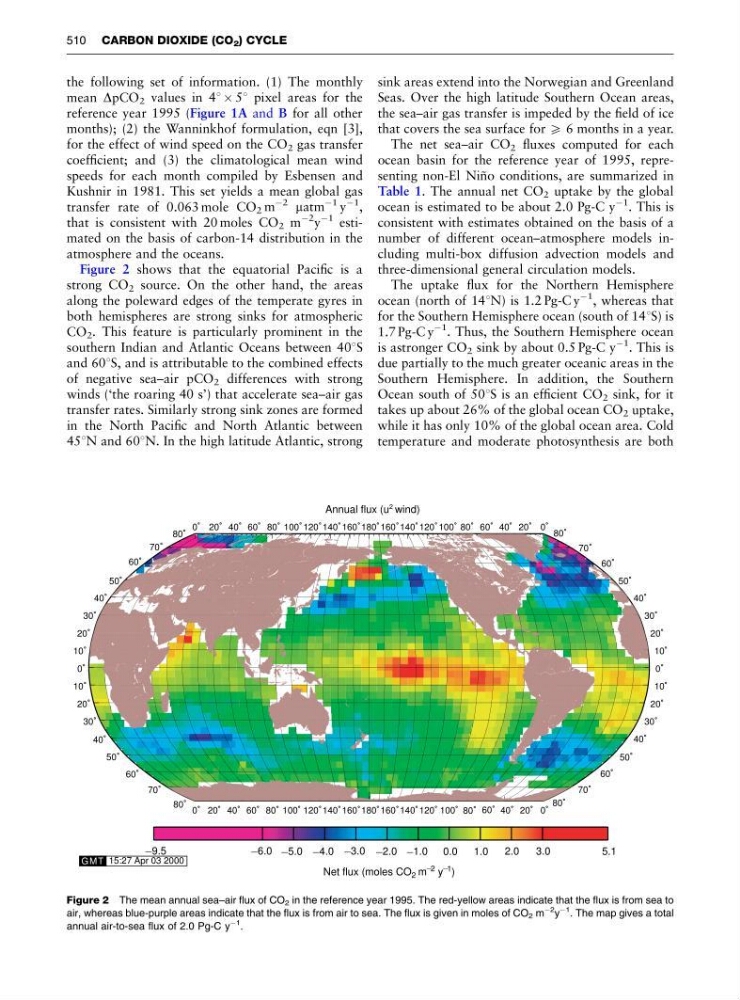
Figure 2 shows that the equatorial Pacific is a
strong CO 2 source. On the other hand, the areas
along the poleward edges of the temperate gyres in
both hemispheres are strong sinks for atmospheric
CO 2 . This feature is particularly prominent in the
southern Indian and Atlantic Oceans between 401S
and 601S, and is attributable to the combined effects
of negative sea–air pCO 2 differences with strong
winds (‘the roaring 40 s’) that accelerate sea–air gas
transfer rates. Similarly strong sink zones are formed
in the North Pacific and North Atlantic between
451N and 601N. In the high latitude Atlantic, strong
sink areas extend into the Norwegian and Greenland
Seas. Over the high latitude Southern Ocean areas,
the sea–air gas transfer is impeded by the field of ice
that covers the sea surface for X 6 months in a year.
The net sea–air CO 2 fluxes computed for each
ocean basin for the reference year of 1995, representing non-El Nin ˜ o conditions, are summarized in
Table 1. The annual net CO 2 uptake by the global
ocean is estimated to be about 2.0 Pg-C y
À1 . This is
consistent with estimates obtained on the basis of a
number of different ocean–atmosphere models including multi-box diffusion advection models and
three-dimensional general circulation models.
The uptake flux for the Northern Hemisphere
ocean (north of 141N) is 1.2 Pg-C y
À1
, whereas that
for the Southern Hemisphere ocean (south of 141S) is
1.7 Pg-C y
À1
. Thus, the Southern Hemisphere ocean
is astronger CO 2 sink by about 0.5 Pg-C y
À1
. This is
due partially to the much greater oceanic areas in the
Southern Hemisphere. In addition, the Southern
Ocean south of 501S is an efficient CO 2 sink, for it
takes up about 26% of the global ocean CO 2 uptake,
while it has only 10% of the global ocean area. Cold
temperature and moderate photosynthesis are both
GMT15:27 Apr 03 2000
0˚
0˚
20˚
20˚
40˚
40˚
60˚
60˚
80˚
80˚
100˚
100˚
120˚
120˚
140˚
140˚
160˚
160˚
180˚
180˚
160˚
160˚
140˚
140˚
120˚
120˚
100˚
100˚
80˚
80˚
60˚
60˚
40˚
40˚
20˚
20˚
0˚
0˚
80˚
80˚
70˚
70˚
60˚
60˚
50˚
50˚
40˚
40˚
30˚
30˚
20˚
20˚
10˚
10˚
0˚
0˚
10˚
10˚
20˚
20˚
30˚
30˚
40˚
40˚
50˚
50˚
60˚
60˚
70˚
70˚
80˚
80˚
Annual flux (u
2 wind)
0.0
1.0
Net flux (moles CO 2 m
_ 2 y
_ 1
)
5.1
3.0
2.0
_ 1.0
_ 2.0
_ 3.0
_ 4.0
_ 5.0
_ 6.0
GMT
_ 9.5
Figure 2 The mean annual sea–air flux of CO 2 in the reference year 1995. The red-yellow areas indicate that the flux is from sea to
air, whereas blue-purple areas indicate that the flux is from air to sea. The flux is given in moles of CO 2 m
À2 y
À1 . The map gives a total
annual air-to-sea flux of 2.0 Pg-C y
À1 .
510 CARBON DIOXIDE (CO 2 ) CYCLE
mean DpCO 2 values in 41 Â 51 pixel areas for the
reference year 1995 (Figure 1A and B for all other
months); (2) the Wanninkhof formulation, eqn [3],
for the effect of wind speed on the CO 2 gas transfer
coefficient; and (3) the climatological mean wind
speeds for each month compiled by Esbensen and
Kushnir in 1981. This set yields a mean global gas
transfer rate of 0.063 mole CO 2 m
À2 matm
À1 y
À1
,
that is consistent with 20 moles CO 2 m
À2
y
À1 estimated on the basis of carbon-14 distribution in the
atmosphere and the oceans.
Figure 2 shows that the equatorial Pacific is a
strong CO 2 source. On the other hand, the areas
along the poleward edges of the temperate gyres in
both hemispheres are strong sinks for atmospheric
CO 2 . This feature is particularly prominent in the
southern Indian and Atlantic Oceans between 401S
and 601S, and is attributable to the combined effects
of negative sea–air pCO 2 differences with strong
winds (‘the roaring 40 s’) that accelerate sea–air gas
transfer rates. Similarly strong sink zones are formed
in the North Pacific and North Atlantic between
451N and 601N. In the high latitude Atlantic, strong
sink areas extend into the Norwegian and Greenland
Seas. Over the high latitude Southern Ocean areas,
the sea–air gas transfer is impeded by the field of ice
that covers the sea surface for X 6 months in a year.
The net sea–air CO 2 fluxes computed for each
ocean basin for the reference year of 1995, representing non-El Nin ˜ o conditions, are summarized in
Table 1. The annual net CO 2 uptake by the global
ocean is estimated to be about 2.0 Pg-C y
À1 . This is
consistent with estimates obtained on the basis of a
number of different ocean–atmosphere models including multi-box diffusion advection models and
three-dimensional general circulation models.
The uptake flux for the Northern Hemisphere
ocean (north of 141N) is 1.2 Pg-C y
À1
, whereas that
for the Southern Hemisphere ocean (south of 141S) is
1.7 Pg-C y
À1
. Thus, the Southern Hemisphere ocean
is astronger CO 2 sink by about 0.5 Pg-C y
À1
. This is
due partially to the much greater oceanic areas in the
Southern Hemisphere. In addition, the Southern
Ocean south of 501S is an efficient CO 2 sink, for it
takes up about 26% of the global ocean CO 2 uptake,
while it has only 10% of the global ocean area. Cold
temperature and moderate photosynthesis are both
GMT15:27 Apr 03 2000
0˚
0˚
20˚
20˚
40˚
40˚
60˚
60˚
80˚
80˚
100˚
100˚
120˚
120˚
140˚
140˚
160˚
160˚
180˚
180˚
160˚
160˚
140˚
140˚
120˚
120˚
100˚
100˚
80˚
80˚
60˚
60˚
40˚
40˚
20˚
20˚
0˚
0˚
80˚
80˚
70˚
70˚
60˚
60˚
50˚
50˚
40˚
40˚
30˚
30˚
20˚
20˚
10˚
10˚
0˚
0˚
10˚
10˚
20˚
20˚
30˚
30˚
40˚
40˚
50˚
50˚
60˚
60˚
70˚
70˚
80˚
80˚
Annual flux (u
2 wind)
0.0
1.0
Net flux (moles CO 2 m
_ 2 y
_ 1
)
5.1
3.0
2.0
_ 1.0
_ 2.0
_ 3.0
_ 4.0
_ 5.0
_ 6.0
GMT
_ 9.5
Figure 2 The mean annual sea–air flux of CO 2 in the reference year 1995. The red-yellow areas indicate that the flux is from sea to
air, whereas blue-purple areas indicate that the flux is from air to sea. The flux is given in moles of CO 2 m
À2 y
À1 . The map gives a total
annual air-to-sea flux of 2.0 Pg-C y
À1 .
510 CARBON DIOXIDE (CO 2 ) CYCLE