

forms, including dissolved CO 2 , bicarbonate
(HCO 3
À
), carbonate (CO 3
2À ) and organic compounds.
CO 2 is one of the most soluble of the major gases in
sea water and the ocean has an enormous capacity to
buffer changes in the atmospheric CO 2 content.
The concentration of dissolved CO 2 in sea water is
relatively small because CO 2 reacts with water to
form a weak acid, carbonic acid (H 2 CO 3 ), which
rapidly dissociates (within milliseconds) to form
HCO 3
À and CO 3
2À
(eqn [I]).
CO 2 gas
ð ÞþH 2 O"H 2 CO 3 aq
ð Þ"H
þ aq
ð Þ
þHCO
À
3 aq
ð Þ"2H
þ aq
ð Þ þ CO
2À
3 aq
ð Þ
½I
For every 20 molecules of CO 2 absorbed by the
ocean, 19 molecules are rapidly converted to HCO 3
À
and CO 3
2À
; at the typical range of pH in sea water
(7.8–8.2; see below), most inorganic carbon is found
in the form of HCO 3
À
. These reactions (eqn [I]) provide a chemical buffer, maintain the pH of the ocean
within a small range, and constrain the amount of
atmospheric CO 2 that can be taken up by the ocean.
The amount of dissolved CO 2 in sea water cannot
be determined analytically but can be calculated after
measuring other inorganic carbon species. Dissolved
inorganic carbon (DIC) refers to the total amount of
CO 2 , HCO 3
À plus CO 3
2À in sea water, while the partial pressure of CO 2 (PCO 2 ) measures the contribution of CO 2 to total gas pressure. The alkalinity of
sea water (A) is a measure of the bases present in sea
water, consisting mainly of HCO 3
À and CO 3
2À
(A[HCO 3
À ] þ 2[CO 3
2À ]) and minor constituents such
as borate (BO 4 ) and hydrogen ions (H
þ ). Changes in
DIC concentration and alkalinity affect the solubility
of CO 2 in sea water (i.e., the ability of sea water to
absorb CO 2 ) (see below).
The concentrations of inorganic carbon species in
sea water are controlled not only by the chemical
reactions outlined above (i.e., eqn [I]) but also by
various physical and biological processes, including
the exchange of CO 2 between ocean and atmosphere; the solubility of CO 2 ; photosynthesis and
respiration; and the formation and dissolution of
calcium carbonate (CaCO 3 ).
Typical surface sea water ranges from pH of 7.8 to
8.2. On addition of acid (i.e., H
þ ), the chemical reactions shift toward a higher concentration of CO 2
in sea water (eqn [IIa]) and pH decreases from 8.0 to
7.8 and then pH will rise from 8.0 to 8.2.
H
þ þ HCO
À
3 -H 2 CO 3 -CO 2 aq
ð Þ þ H 2 O ½IIa
If base is added to sea water (eqn [IIb]), then pH will
rise.
H 2 CO 3 -H
þ þ HCO 3
½IIb
Solubility and Exchange of CO 2
between the Ocean and Atmosphere
The solubility of CO 2 in sea water is an important
factor in controlling the exchange of carbon between
the ocean and atmosphere. Henry’s law (eqn [1])
describes the relationship between solubility and sea
water properties, where S equals the solubility of gas
in liquid, k is the solubility constant (k is a function
mainly of temperature) and P is the overlying pressure of the gas in the atmosphere.
S ¼ kP
½1
Sea water properties such as temperature, salinity,
and partial pressure of CO 2 determine the solubility
of CO 2 . For example, at 01C in sea water, the solubility of CO 2 is double that in sea water at 201C;
thus colder water will tend to absorb more CO 2 than
warmer water.
Henry’s law also describes the relationship between the partial pressure of CO 2 in solution (PCO 2 )
and its concentration (i.e., [CO 2 ]). Colder waters
tend to have lower PCO 2 than warmer waters: for
every 11C temperature increase, sea water PCO 2 increases by B4%. Sea water PCO 2 is also influenced
by complicated thermodynamic relationships
380
360
340
320
300
280
1850
1900
1950
2000
Year
PCO
2 (ppmv)
Siple
Mauna Loa
100-year
running mean
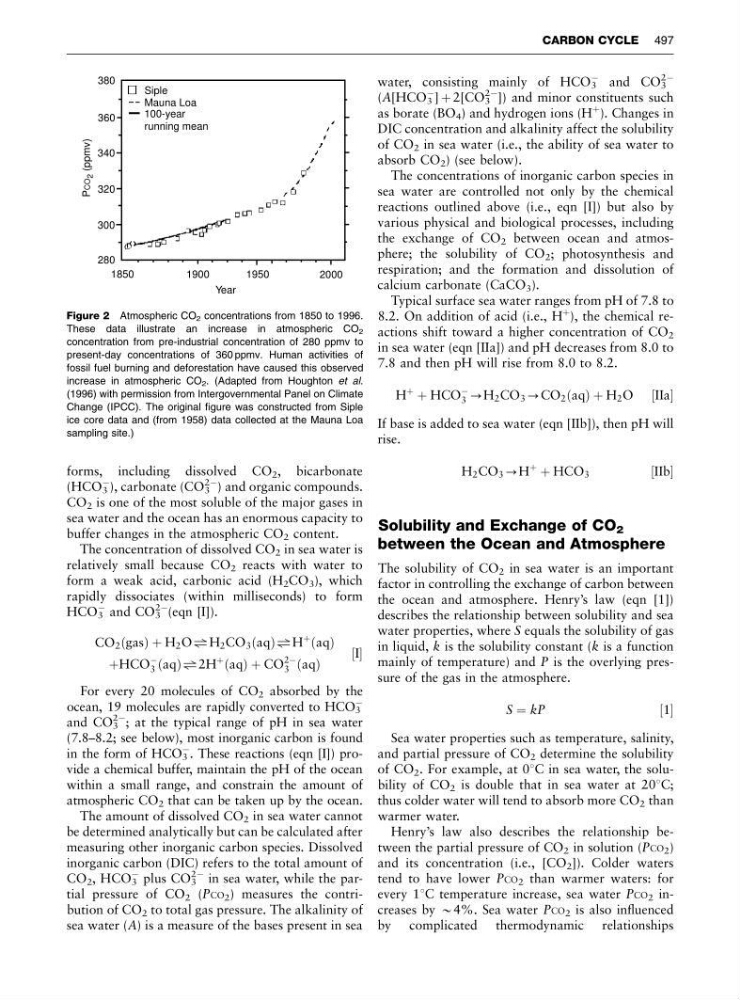
Figure 2 Atmospheric CO 2 concentrations from 1850 to 1996.
These data illustrate an increase in atmospheric CO 2
concentration from pre-industrial concentration of 280 ppmv to
present-day concentrations of 360 ppmv. Human activities of
fossil fuel burning and deforestation have caused this observed
increase in atmospheric CO 2 . (Adapted from Houghton et al.
(1996) with permission from Intergovernmental Panel on Climate
Change (IPCC). The original figure was constructed from Siple
ice core data and (from 1958) data collected at the Mauna Loa
sampling site.)
CARBON CYCLE 497
(HCO 3
À
), carbonate (CO 3
2À ) and organic compounds.
CO 2 is one of the most soluble of the major gases in
sea water and the ocean has an enormous capacity to
buffer changes in the atmospheric CO 2 content.
The concentration of dissolved CO 2 in sea water is
relatively small because CO 2 reacts with water to
form a weak acid, carbonic acid (H 2 CO 3 ), which
rapidly dissociates (within milliseconds) to form
HCO 3
À and CO 3
2À
(eqn [I]).
CO 2 gas
ð ÞþH 2 O"H 2 CO 3 aq
ð Þ"H
þ aq
ð Þ
þHCO
À
3 aq
ð Þ"2H
þ aq
ð Þ þ CO
2À
3 aq
ð Þ
½I
For every 20 molecules of CO 2 absorbed by the
ocean, 19 molecules are rapidly converted to HCO 3
À
and CO 3
2À
; at the typical range of pH in sea water
(7.8–8.2; see below), most inorganic carbon is found
in the form of HCO 3
À
. These reactions (eqn [I]) provide a chemical buffer, maintain the pH of the ocean
within a small range, and constrain the amount of
atmospheric CO 2 that can be taken up by the ocean.
The amount of dissolved CO 2 in sea water cannot
be determined analytically but can be calculated after
measuring other inorganic carbon species. Dissolved
inorganic carbon (DIC) refers to the total amount of
CO 2 , HCO 3
À plus CO 3
2À in sea water, while the partial pressure of CO 2 (PCO 2 ) measures the contribution of CO 2 to total gas pressure. The alkalinity of
sea water (A) is a measure of the bases present in sea
water, consisting mainly of HCO 3
À and CO 3
2À
(A[HCO 3
À ] þ 2[CO 3
2À ]) and minor constituents such
as borate (BO 4 ) and hydrogen ions (H
þ ). Changes in
DIC concentration and alkalinity affect the solubility
of CO 2 in sea water (i.e., the ability of sea water to
absorb CO 2 ) (see below).
The concentrations of inorganic carbon species in
sea water are controlled not only by the chemical
reactions outlined above (i.e., eqn [I]) but also by
various physical and biological processes, including
the exchange of CO 2 between ocean and atmosphere; the solubility of CO 2 ; photosynthesis and
respiration; and the formation and dissolution of
calcium carbonate (CaCO 3 ).
Typical surface sea water ranges from pH of 7.8 to
8.2. On addition of acid (i.e., H
þ ), the chemical reactions shift toward a higher concentration of CO 2
in sea water (eqn [IIa]) and pH decreases from 8.0 to
7.8 and then pH will rise from 8.0 to 8.2.
H
þ þ HCO
À
3 -H 2 CO 3 -CO 2 aq
ð Þ þ H 2 O ½IIa
If base is added to sea water (eqn [IIb]), then pH will
rise.
H 2 CO 3 -H
þ þ HCO 3
½IIb
Solubility and Exchange of CO 2
between the Ocean and Atmosphere
The solubility of CO 2 in sea water is an important
factor in controlling the exchange of carbon between
the ocean and atmosphere. Henry’s law (eqn [1])
describes the relationship between solubility and sea
water properties, where S equals the solubility of gas
in liquid, k is the solubility constant (k is a function
mainly of temperature) and P is the overlying pressure of the gas in the atmosphere.
S ¼ kP
½1
Sea water properties such as temperature, salinity,
and partial pressure of CO 2 determine the solubility
of CO 2 . For example, at 01C in sea water, the solubility of CO 2 is double that in sea water at 201C;
thus colder water will tend to absorb more CO 2 than
warmer water.
Henry’s law also describes the relationship between the partial pressure of CO 2 in solution (PCO 2 )
and its concentration (i.e., [CO 2 ]). Colder waters
tend to have lower PCO 2 than warmer waters: for
every 11C temperature increase, sea water PCO 2 increases by B4%. Sea water PCO 2 is also influenced
by complicated thermodynamic relationships
380
360
340
320
300
280
1850
1900
1950
2000
Year
PCO
2 (ppmv)
Siple
Mauna Loa
100-year
running mean
Figure 2 Atmospheric CO 2 concentrations from 1850 to 1996.
These data illustrate an increase in atmospheric CO 2
concentration from pre-industrial concentration of 280 ppmv to
present-day concentrations of 360 ppmv. Human activities of
fossil fuel burning and deforestation have caused this observed
increase in atmospheric CO 2 . (Adapted from Houghton et al.
(1996) with permission from Intergovernmental Panel on Climate
Change (IPCC). The original figure was constructed from Siple
ice core data and (from 1958) data collected at the Mauna Loa
sampling site.)
CARBON CYCLE 497