

off North and South Carolina could be explained by
surface inputs (Figure 6). The remaining inventory
enters the system via SGD. Using an estimate of
groundwater
226 Ra, it is calculated that the groundwater flux to this region of the coastline is on the
order of 40% of the river water flux.
The approach for quantifying SGD using
222 Rn is
similar to that for radium (
226 Ra), except for a few
key differences: (1)
222 Rn loss to the atmosphere
must be accounted for in many situations, (2) there is
no significant source from particles in rivers, and
(3) decay must be accounted for owing to its relatively short half-life. The first example of
222
Rn use
to quantify SGD to the coastal zone occurred in a
study in the northeastern Gulf of Mexico. The strong
pycnocline that develops in the summer time means
that fluid that flows from the sediments into the
bottom boundary layer is isolated from the atmosphere and therefore no correction for the air–sea loss
of
222 Rn is needed. Using this approach, diffuse SGD
in a 620 km
2 area of the inner shelf was estimated to
be equivalent to B20 first-magnitude springs (a firstmagnitude spring has a flow equal to or greater than
245 000 m
3 water per day, which is equivalent to
B60% of the daily water supply for the entire state
of Rhode Island, USA).
Since 2000, a number of SGD estimation technique
intercomparison experiments have been conducted
through a project sponsored by the Scientific Committee on Oceanic Research (SCOR) and the Land–
Ocean Interaction in the Coastal Zone (LOICZ)
Project. During these intercomparisons, several
methods (chemical tracers, different types of seep
meters, hydrogeologic approaches, etc.) were run side
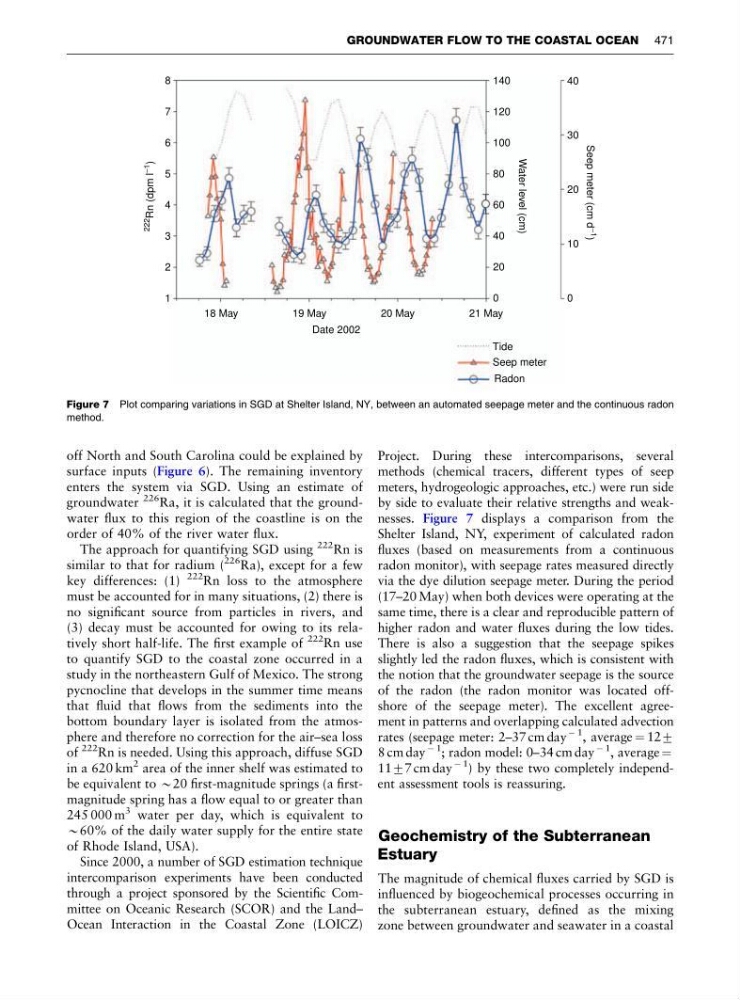
by side to evaluate their relative strengths and weaknesses. Figure 7 displays a comparison from the
Shelter Island, NY, experiment of calculated radon
fluxes (based on measurements from a continuous
radon monitor), with seepage rates measured directly
via the dye dilution seepage meter. During the period
(17–20 May) when both devices were operating at the
same time, there is a clear and reproducible pattern of
higher radon and water fluxes during the low tides.
There is also a suggestion that the seepage spikes
slightly led the radon fluxes, which is consistent with
the notion that the groundwater seepage is the source
of the radon (the radon monitor was located offshore of the seepage meter). The excellent agreement in patterns and overlapping calculated advection
rates (seepage meter: 2–37 cm day
À 1
, average ¼ 127
8 cm day
À 1
; radon model: 0–34 cm day
À 1
, average ¼
1177 cm day
À 1
) by these two completely independent assessment tools is reassuring.
Geochemistry of the Subterranean
Estuary
The magnitude of chemical fluxes carried by SGD is
influenced by biogeochemical processes occurring in
the subterranean estuary, defined as the mixing
zone between groundwater and seawater in a coastal
8
7
6
5
4
3
2
1
18 May
19 May
Date 2002
20 May
21 May
Tide
Radon
Seep meter
140
40
30
20
10
0
120
100
80
60
40
20
0
Water level (cm)
222
Rn (dpm l
−1
)
Seep meter (cm d −1 )
Figure 7 Plot comparing variations in SGD at Shelter Island, NY, between an automated seepage meter and the continuous radon
method.
GROUNDWATER FLOW TO THE COASTAL OCEAN 471
surface inputs (Figure 6). The remaining inventory
enters the system via SGD. Using an estimate of
groundwater
226 Ra, it is calculated that the groundwater flux to this region of the coastline is on the
order of 40% of the river water flux.
The approach for quantifying SGD using
222 Rn is
similar to that for radium (
226 Ra), except for a few
key differences: (1)
222 Rn loss to the atmosphere
must be accounted for in many situations, (2) there is
no significant source from particles in rivers, and
(3) decay must be accounted for owing to its relatively short half-life. The first example of
222
Rn use
to quantify SGD to the coastal zone occurred in a
study in the northeastern Gulf of Mexico. The strong
pycnocline that develops in the summer time means
that fluid that flows from the sediments into the
bottom boundary layer is isolated from the atmosphere and therefore no correction for the air–sea loss
of
222 Rn is needed. Using this approach, diffuse SGD
in a 620 km
2 area of the inner shelf was estimated to
be equivalent to B20 first-magnitude springs (a firstmagnitude spring has a flow equal to or greater than
245 000 m
3 water per day, which is equivalent to
B60% of the daily water supply for the entire state
of Rhode Island, USA).
Since 2000, a number of SGD estimation technique
intercomparison experiments have been conducted
through a project sponsored by the Scientific Committee on Oceanic Research (SCOR) and the Land–
Ocean Interaction in the Coastal Zone (LOICZ)
Project. During these intercomparisons, several
methods (chemical tracers, different types of seep
meters, hydrogeologic approaches, etc.) were run side
by side to evaluate their relative strengths and weaknesses. Figure 7 displays a comparison from the
Shelter Island, NY, experiment of calculated radon
fluxes (based on measurements from a continuous
radon monitor), with seepage rates measured directly
via the dye dilution seepage meter. During the period
(17–20 May) when both devices were operating at the
same time, there is a clear and reproducible pattern of
higher radon and water fluxes during the low tides.
There is also a suggestion that the seepage spikes
slightly led the radon fluxes, which is consistent with
the notion that the groundwater seepage is the source
of the radon (the radon monitor was located offshore of the seepage meter). The excellent agreement in patterns and overlapping calculated advection
rates (seepage meter: 2–37 cm day
À 1
, average ¼ 127
8 cm day
À 1
; radon model: 0–34 cm day
À 1
, average ¼
1177 cm day
À 1
) by these two completely independent assessment tools is reassuring.
Geochemistry of the Subterranean
Estuary
The magnitude of chemical fluxes carried by SGD is
influenced by biogeochemical processes occurring in
the subterranean estuary, defined as the mixing
zone between groundwater and seawater in a coastal
8
7
6
5
4
3
2
1
18 May
19 May
Date 2002
20 May
21 May
Tide
Radon
Seep meter
140
40
30
20
10
0
120
100
80
60
40
20
0
Water level (cm)
222
Rn (dpm l
−1
)
Seep meter (cm d −1 )
Figure 7 Plot comparing variations in SGD at Shelter Island, NY, between an automated seepage meter and the continuous radon
method.
GROUNDWATER FLOW TO THE COASTAL OCEAN 471