

0
0
(b)
50
100
150
200
0
50
100
150
0
50
100
150
200
1500
3000
Fe (ppm)
Fe (ppm)
Fe (ppm)
4500
0
1500
3000
4500
0
1500
3000
4500
0
50
100
P (ppm)
P (ppm)
P (ppm)
150
Core 2
Core 3
Core 5
200
0
50
100
150
200
200
0
50
100
150
200
Dark red
Tan/red Tan/gray
Red/orange
Gray
Gray
Gray
Gray/yellow
Orange
Yellow
Depth (cm)
(a)
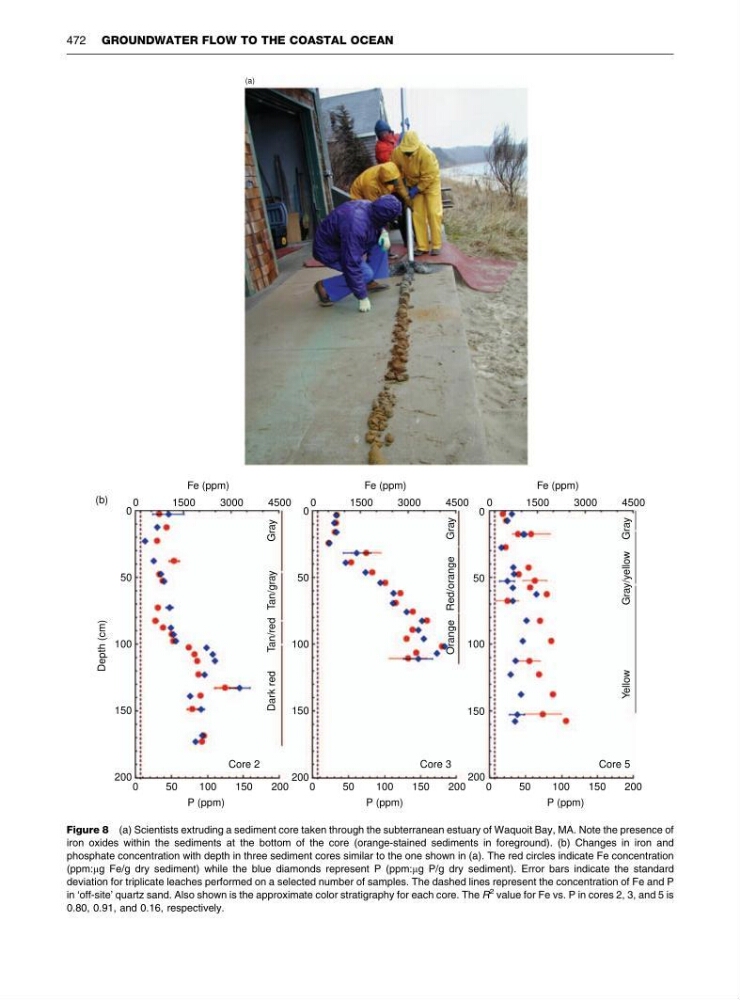
Figure 8 (a) Scientists extruding a sediment core taken through the subterranean estuary of Waquoit Bay, MA. Note the presence of
iron oxides within the sediments at the bottom of the core (orange-stained sediments in foreground). (b) Changes in iron and
phosphate concentration with depth in three sediment cores similar to the one shown in (a). The red circles indicate Fe concentration
(ppm:mg Fe/g dry sediment) while the blue diamonds represent P (ppm:mg P/g dry sediment). Error bars indicate the standard
deviation for triplicate leaches performed on a selected number of samples. The dashed lines represent the concentration of Fe and P
in ‘off-site’ quartz sand. Also shown is the approximate color stratigraphy for each core. The R
2 value for Fe vs. P in cores 2, 3, and 5 is
0.80, 0.91, and 0.16, respectively.
472 GROUNDWATER FLOW TO THE COASTAL OCEAN
0
(b)
50
100
150
200
0
50
100
150
0
50
100
150
200
1500
3000
Fe (ppm)
Fe (ppm)
Fe (ppm)
4500
0
1500
3000
4500
0
1500
3000
4500
0
50
100
P (ppm)
P (ppm)
P (ppm)
150
Core 2
Core 3
Core 5
200
0
50
100
150
200
200
0
50
100
150
200
Dark red
Tan/red Tan/gray
Red/orange
Gray
Gray
Gray
Gray/yellow
Orange
Yellow
Depth (cm)
(a)
Figure 8 (a) Scientists extruding a sediment core taken through the subterranean estuary of Waquoit Bay, MA. Note the presence of
iron oxides within the sediments at the bottom of the core (orange-stained sediments in foreground). (b) Changes in iron and
phosphate concentration with depth in three sediment cores similar to the one shown in (a). The red circles indicate Fe concentration
(ppm:mg Fe/g dry sediment) while the blue diamonds represent P (ppm:mg P/g dry sediment). Error bars indicate the standard
deviation for triplicate leaches performed on a selected number of samples. The dashed lines represent the concentration of Fe and P
in ‘off-site’ quartz sand. Also shown is the approximate color stratigraphy for each core. The R
2 value for Fe vs. P in cores 2, 3, and 5 is
0.80, 0.91, and 0.16, respectively.
472 GROUNDWATER FLOW TO THE COASTAL OCEAN