

change in water volume over the sampling period is
then used to determine the average flow rate of fluid
across the water–sediment boundary over the length
of the sampling period. These meters are very
simple to operate, but they are manually intensive
and are sensitive to wave disturbance and currents.
Furthermore, they only sample a small flow area
and so many meters are needed to characterize the
spatial variability seen at most sites (Figure 3).
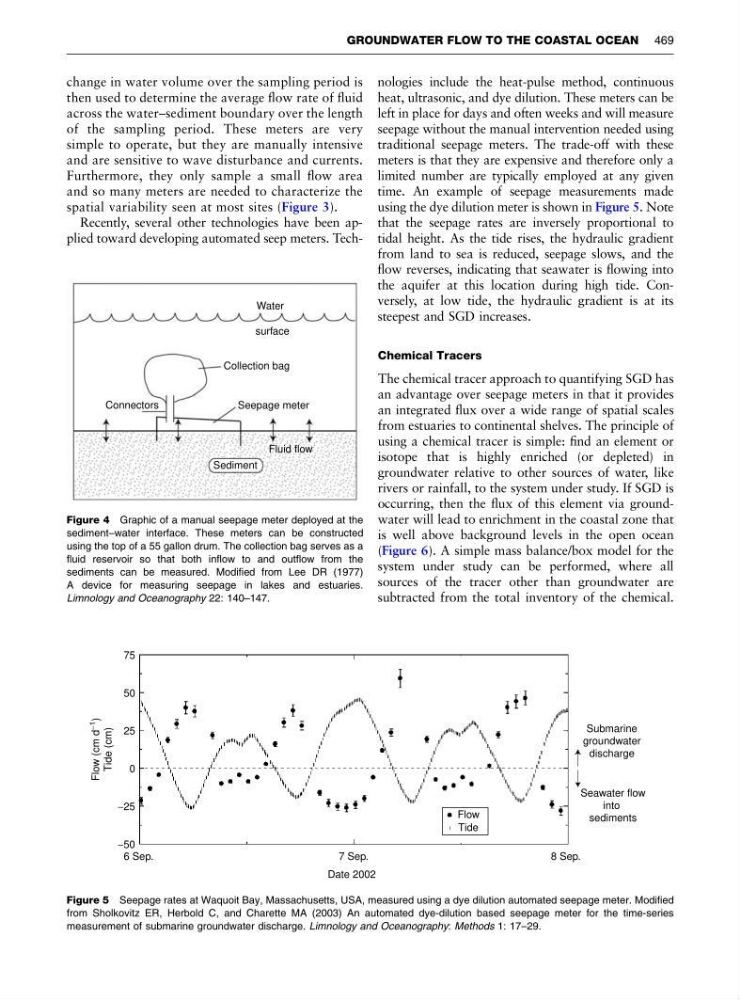
Recently, several other technologies have been applied toward developing automated seep meters. Technologies include the heat-pulse method, continuous
heat, ultrasonic, and dye dilution. These meters can be
left in place for days and often weeks and will measure
seepage without the manual intervention needed using
traditional seepage meters. The trade-off with these
meters is that they are expensive and therefore only a
limited number are typically employed at any given
time. An example of seepage measurements made
using the dye dilution meter is shown in Figure 5. Note
that the seepage rates are inversely proportional to
tidal height. As the tide rises, the hydraulic gradient
from land to sea is reduced, seepage slows, and the
flow reverses, indicating that seawater is flowing into
the aquifer at this location during high tide. Conversely, at low tide, the hydraulic gradient is at its
steepest and SGD increases.
Chemical Tracers
The chemical tracer approach to quantifying SGD has
an advantage over seepage meters in that it provides
an integrated flux over a wide range of spatial scales
from estuaries to continental shelves. The principle of
using a chemical tracer is simple: find an element or
isotope that is highly enriched (or depleted) in
groundwater relative to other sources of water, like
rivers or rainfall, to the system under study. If SGD is
occurring, then the flux of this element via groundwater will lead to enrichment in the coastal zone that
is well above background levels in the open ocean
(Figure 6). A simple mass balance/box model for the
system under study can be performed, where all
sources of the tracer other than groundwater are
subtracted from the total inventory of the chemical.
Water
surface
Collection bag
Seepage meter
Connectors
Sediment
Fluid flow
Figure 4 Graphic of a manual seepage meter deployed at the
sediment–water interface. These meters can be constructed
using the top of a 55 gallon drum. The collection bag serves as a
fluid reservoir so that both inflow to and outflow from the
sediments can be measured. Modified from Lee DR (1977)
A device for measuring seepage in lakes and estuaries.
Limnology and Oceanography 22: 140–147.
75
50
25
0
Flow (cm d
−1
)
Tide (cm)
6 Sep.
7 Sep.
8 Sep.
−25
−50
Submarine
groundwater
discharge
Seawater flow
into
sediments
Flow
Tide
Date 2002
Figure 5 Seepage rates at Waquoit Bay, Massachusetts, USA, measured using a dye dilution automated seepage meter. Modified
from Sholkovitz ER, Herbold C, and Charette MA (2003) An automated dye-dilution based seepage meter for the time-series
measurement of submarine groundwater discharge. Limnology and Oceanography: Methods 1: 17–29.
GROUNDWATER FLOW TO THE COASTAL OCEAN 469
then used to determine the average flow rate of fluid
across the water–sediment boundary over the length
of the sampling period. These meters are very
simple to operate, but they are manually intensive
and are sensitive to wave disturbance and currents.
Furthermore, they only sample a small flow area
and so many meters are needed to characterize the
spatial variability seen at most sites (Figure 3).
Recently, several other technologies have been applied toward developing automated seep meters. Technologies include the heat-pulse method, continuous
heat, ultrasonic, and dye dilution. These meters can be
left in place for days and often weeks and will measure
seepage without the manual intervention needed using
traditional seepage meters. The trade-off with these
meters is that they are expensive and therefore only a
limited number are typically employed at any given
time. An example of seepage measurements made
using the dye dilution meter is shown in Figure 5. Note
that the seepage rates are inversely proportional to
tidal height. As the tide rises, the hydraulic gradient
from land to sea is reduced, seepage slows, and the
flow reverses, indicating that seawater is flowing into
the aquifer at this location during high tide. Conversely, at low tide, the hydraulic gradient is at its
steepest and SGD increases.
Chemical Tracers
The chemical tracer approach to quantifying SGD has
an advantage over seepage meters in that it provides
an integrated flux over a wide range of spatial scales
from estuaries to continental shelves. The principle of
using a chemical tracer is simple: find an element or
isotope that is highly enriched (or depleted) in
groundwater relative to other sources of water, like
rivers or rainfall, to the system under study. If SGD is
occurring, then the flux of this element via groundwater will lead to enrichment in the coastal zone that
is well above background levels in the open ocean
(Figure 6). A simple mass balance/box model for the
system under study can be performed, where all
sources of the tracer other than groundwater are
subtracted from the total inventory of the chemical.
Water
surface
Collection bag
Seepage meter
Connectors
Sediment
Fluid flow
Figure 4 Graphic of a manual seepage meter deployed at the
sediment–water interface. These meters can be constructed
using the top of a 55 gallon drum. The collection bag serves as a
fluid reservoir so that both inflow to and outflow from the
sediments can be measured. Modified from Lee DR (1977)
A device for measuring seepage in lakes and estuaries.
Limnology and Oceanography 22: 140–147.
75
50
25
0
Flow (cm d
−1
)
Tide (cm)
6 Sep.
7 Sep.
8 Sep.
−25
−50
Submarine
groundwater
discharge
Seawater flow
into
sediments
Flow
Tide
Date 2002
Figure 5 Seepage rates at Waquoit Bay, Massachusetts, USA, measured using a dye dilution automated seepage meter. Modified
from Sholkovitz ER, Herbold C, and Charette MA (2003) An automated dye-dilution based seepage meter for the time-series
measurement of submarine groundwater discharge. Limnology and Oceanography: Methods 1: 17–29.
GROUNDWATER FLOW TO THE COASTAL OCEAN 469