

expensive, well installations. Finally, hydraulic head
is a point measurement and capturing the spatial
variability therefore requires installing many wells.
The primary advantage of this approach is that it is
well established and easy to implement: head measurements are easy to collect once wells are installed
and the flux calculations are simple.
The mass balance approach to estimating SGD
requires ascertaining all inputs and outputs of water
flow, except SGD, through the groundwatershed.
Assuming a steady-state condition over a specified
time frame, the groundwater discharge rate is calculated as the difference between all inputs and all
outputs. Implementing this approach can be quite
simple or can result in complex field campaigns, but
the quality of the data obviously affect the level of
uncertainty. Even with extensive field sampling,
water budgets are seldom known with certainty and
so should be used with that in mind. Furthermore, if
the spatial and temporal variability of SGD is needed
for a particular study, the mass balance approach is
not appropriate.
Direct measurements: Seepage meters SGD can be
measured directly with seepage meters. Manual
seepage meters (Figure 4) are constructed using the
tops of 55 gallon drums, where one end is open and
placed into the sediment. The top of the seepage
meter has a valve through which water can flow;
a plastic bag prefilled with a known volume of
water is attached to the valve, so that inflow to or
outflow from the sediments can be determined.
After a set length of time, the bag is removed and
the volume of water in the bag is measured. The
Temp. (°C)
2.3
2.4−7.4
7.5−8
8.1−9
9.1−9.5
9.6−10
10.1−10.5
10.6−11
11.1−11.5
11.6−12
12.1−12.5
12.6−13
13.1−13.5
13.6−14
14.1−14.5
14.6−15
15.1−15.5
15.6−16
16.1−16.5
16.6−17
17.1−17.5
17.6−18
18.1−18.5
18.6−19
19.1−19.5
19.6−20
20.1−20.5
25
Beach/water line
15
18
12
9
9
11 11
9
11
18
14
0
50
100
200 m
Waquoit Bay
c o n to u r
3 - m to p o g r a p h ic
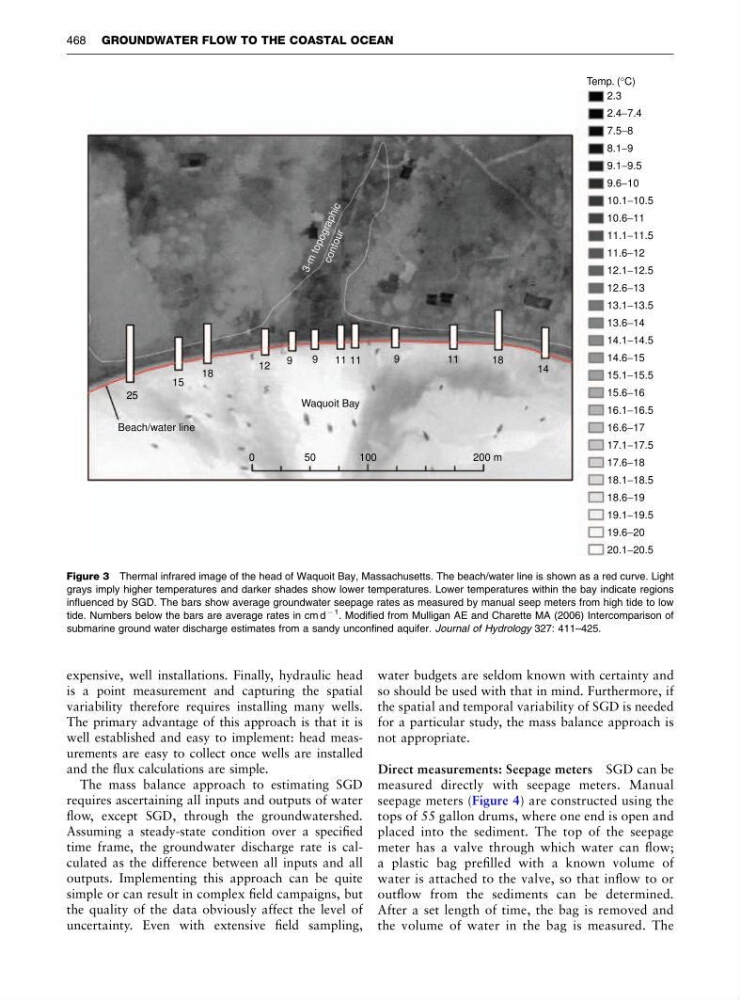
Figure 3 Thermal infrared image of the head of Waquoit Bay, Massachusetts. The beach/water line is shown as a red curve. Light
grays imply higher temperatures and darker shades show lower temperatures. Lower temperatures within the bay indicate regions
influenced by SGD. The bars show average groundwater seepage rates as measured by manual seep meters from high tide to low
tide. Numbers below the bars are average rates in cm d
À 1 . Modified from Mulligan AE and Charette MA (2006) Intercomparison of
submarine ground water discharge estimates from a sandy unconfined aquifer. Journal of Hydrology 327: 411–425.
468 GROUNDWATER FLOW TO THE COASTAL OCEAN
is a point measurement and capturing the spatial
variability therefore requires installing many wells.
The primary advantage of this approach is that it is
well established and easy to implement: head measurements are easy to collect once wells are installed
and the flux calculations are simple.
The mass balance approach to estimating SGD
requires ascertaining all inputs and outputs of water
flow, except SGD, through the groundwatershed.
Assuming a steady-state condition over a specified
time frame, the groundwater discharge rate is calculated as the difference between all inputs and all
outputs. Implementing this approach can be quite
simple or can result in complex field campaigns, but
the quality of the data obviously affect the level of
uncertainty. Even with extensive field sampling,
water budgets are seldom known with certainty and
so should be used with that in mind. Furthermore, if
the spatial and temporal variability of SGD is needed
for a particular study, the mass balance approach is
not appropriate.
Direct measurements: Seepage meters SGD can be
measured directly with seepage meters. Manual
seepage meters (Figure 4) are constructed using the
tops of 55 gallon drums, where one end is open and
placed into the sediment. The top of the seepage
meter has a valve through which water can flow;
a plastic bag prefilled with a known volume of
water is attached to the valve, so that inflow to or
outflow from the sediments can be determined.
After a set length of time, the bag is removed and
the volume of water in the bag is measured. The
Temp. (°C)
2.3
2.4−7.4
7.5−8
8.1−9
9.1−9.5
9.6−10
10.1−10.5
10.6−11
11.1−11.5
11.6−12
12.1−12.5
12.6−13
13.1−13.5
13.6−14
14.1−14.5
14.6−15
15.1−15.5
15.6−16
16.1−16.5
16.6−17
17.1−17.5
17.6−18
18.1−18.5
18.6−19
19.1−19.5
19.6−20
20.1−20.5
25
Beach/water line
15
18
12
9
9
11 11
9
11
18
14
0
50
100
200 m
Waquoit Bay
c o n to u r
3 - m to p o g r a p h ic
Figure 3 Thermal infrared image of the head of Waquoit Bay, Massachusetts. The beach/water line is shown as a red curve. Light
grays imply higher temperatures and darker shades show lower temperatures. Lower temperatures within the bay indicate regions
influenced by SGD. The bars show average groundwater seepage rates as measured by manual seep meters from high tide to low
tide. Numbers below the bars are average rates in cm d
À 1 . Modified from Mulligan AE and Charette MA (2006) Intercomparison of
submarine ground water discharge estimates from a sandy unconfined aquifer. Journal of Hydrology 327: 411–425.
468 GROUNDWATER FLOW TO THE COASTAL OCEAN