

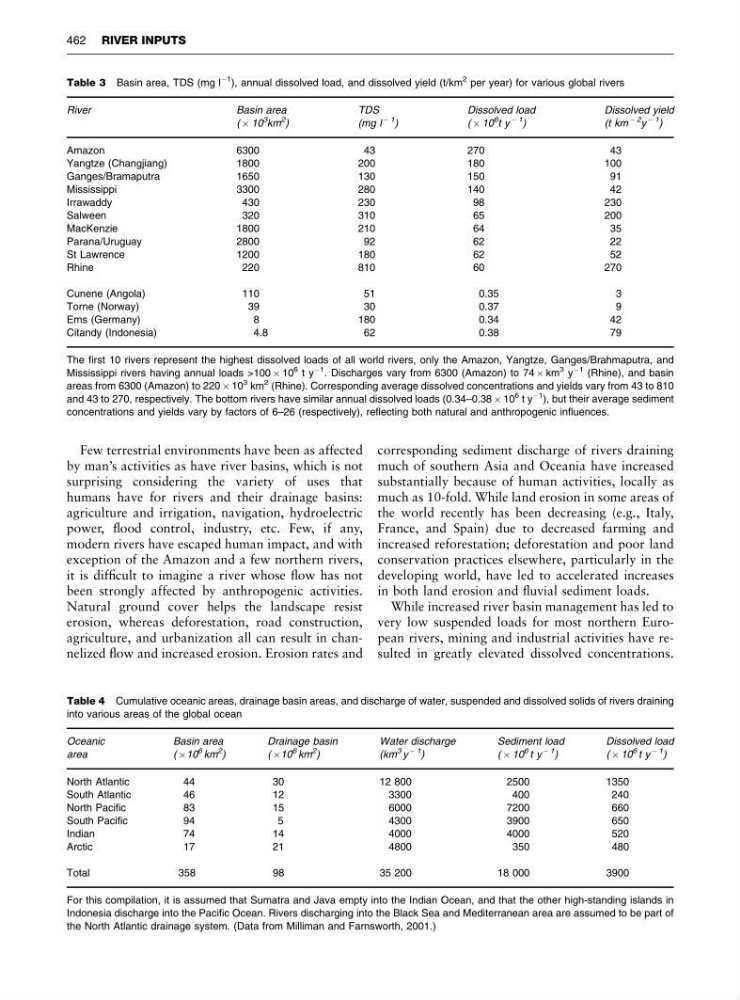
Few terrestrial environments have been as affected
by man’s activities as have river basins, which is not
surprising considering the variety of uses that
humans have for rivers and their drainage basins:
agriculture and irrigation, navigation, hydroelectric
power, flood control, industry, etc. Few, if any,
modern rivers have escaped human impact, and with
exception of the Amazon and a few northern rivers,
it is difficult to imagine a river whose flow has not
been strongly affected by anthropogenic activities.
Natural ground cover helps the landscape resist
erosion, whereas deforestation, road construction,
agriculture, and urbanization all can result in channelized flow and increased erosion. Erosion rates and
corresponding sediment discharge of rivers draining
much of southern Asia and Oceania have increased
substantially because of human activities, locally as
much as 10-fold. While land erosion in some areas of
the world recently has been decreasing (e.g., Italy,
France, and Spain) due to decreased farming and
increased reforestation; deforestation and poor land
conservation practices elsewhere, particularly in the
developing world, have led to accelerated increases
in both land erosion and fluvial sediment loads.
While increased river basin management has led to
very low suspended loads for most northern European rivers, mining and industrial activities have resulted in greatly elevated dissolved concentrations.
Table 4 Cumulative oceanic areas, drainage basin areas, and discharge of water, suspended and dissolved solids of rivers draining
into various areas of the global ocean
Oceanic
Basin area
Drainage basin
Water discharge
Sediment load
Dissolved load
area
( Â10
6 km
2 )
( Â10
6 km
2 )
(km
3 y
À 1
)
( Â 10
6 t y
À 1
)
( Â 10
6 t y
À 1 )
North Atlantic
44
30
12 800
2500
1350
South Atlantic
46
12
3300
400
240
North Pacific
83
15
6000
7200
660
South Pacific
94
5
4300
3900
650
Indian
74
14
4000
4000
520
Arctic
17
21
4800
350
480
Total
358
98
35 200
18 000
3900
For this compilation, it is assumed that Sumatra and Java empty into the Indian Ocean, and that the other high-standing islands in
Indonesia discharge into the Pacific Ocean. Rivers discharging into the Black Sea and Mediterranean area are assumed to be part of
the North Atlantic drainage system. (Data from Milliman and Farnsworth, 2001.)
Table 3 Basin area, TDS (mg l
À1 ), annual dissolved load, and dissolved yield (t/km
2 per year) for various global rivers
River
Basin area
TDS
Dissolved load
Dissolved yield
( Â 10
3
km
2 )
(mg l
À 1
)
( Â 10
6 t y
À 1
)
( t k m
À 2
y
À 1
)
Amazon
6300
43
270
43
Yangtze (Changjiang)
1800
200
180
100
Ganges/Bramaputra
1650
130
150
91
Mississippi
3300
280
140
42
Irrawaddy
430
230
98
230
Salween
320
310
65
200
MacKenzie
1800
210
64
35
Parana/Uruguay
2800
92
62
22
St Lawrence
1200
180
62
52
Rhine
220
810
60
270
Cunene (Angola)
110
51
0.35
3
Torne (Norway)
39
30
0.37
9
Ems (Germany)
8
180
0.34
42
Citandy (Indonesia)
4.8
62
0.38
79
The first 10 rivers represent the highest dissolved loads of all world rivers, only the Amazon, Yangtze, Ganges/Brahmaputra, and
Mississippi rivers having annual loads >100 Â 10
6 t y
À1 . Discharges vary from 6300 (Amazon) to 74 Â km
3 y
À1 (Rhine), and basin
areas from 6300 (Amazon) to 220 Â 10
3 km
2 (Rhine). Corresponding average dissolved concentrations and yields vary from 43 to 810
and 43 to 270, respectively. The bottom rivers have similar annual dissolved loads (0.34–0.38 Â 10
6 t y
À1 ), but their average sediment
concentrations and yields vary by factors of 6–26 (respectively), reflecting both natural and anthropogenic influences.
462 RIVER INPUTS
by man’s activities as have river basins, which is not
surprising considering the variety of uses that
humans have for rivers and their drainage basins:
agriculture and irrigation, navigation, hydroelectric
power, flood control, industry, etc. Few, if any,
modern rivers have escaped human impact, and with
exception of the Amazon and a few northern rivers,
it is difficult to imagine a river whose flow has not
been strongly affected by anthropogenic activities.
Natural ground cover helps the landscape resist
erosion, whereas deforestation, road construction,
agriculture, and urbanization all can result in channelized flow and increased erosion. Erosion rates and
corresponding sediment discharge of rivers draining
much of southern Asia and Oceania have increased
substantially because of human activities, locally as
much as 10-fold. While land erosion in some areas of
the world recently has been decreasing (e.g., Italy,
France, and Spain) due to decreased farming and
increased reforestation; deforestation and poor land
conservation practices elsewhere, particularly in the
developing world, have led to accelerated increases
in both land erosion and fluvial sediment loads.
While increased river basin management has led to
very low suspended loads for most northern European rivers, mining and industrial activities have resulted in greatly elevated dissolved concentrations.
Table 4 Cumulative oceanic areas, drainage basin areas, and discharge of water, suspended and dissolved solids of rivers draining
into various areas of the global ocean
Oceanic
Basin area
Drainage basin
Water discharge
Sediment load
Dissolved load
area
( Â10
6 km
2 )
( Â10
6 km
2 )
(km
3 y
À 1
)
( Â 10
6 t y
À 1
)
( Â 10
6 t y
À 1 )
North Atlantic
44
30
12 800
2500
1350
South Atlantic
46
12
3300
400
240
North Pacific
83
15
6000
7200
660
South Pacific
94
5
4300
3900
650
Indian
74
14
4000
4000
520
Arctic
17
21
4800
350
480
Total
358
98
35 200
18 000
3900
For this compilation, it is assumed that Sumatra and Java empty into the Indian Ocean, and that the other high-standing islands in
Indonesia discharge into the Pacific Ocean. Rivers discharging into the Black Sea and Mediterranean area are assumed to be part of
the North Atlantic drainage system. (Data from Milliman and Farnsworth, 2001.)
Table 3 Basin area, TDS (mg l
À1 ), annual dissolved load, and dissolved yield (t/km
2 per year) for various global rivers
River
Basin area
TDS
Dissolved load
Dissolved yield
( Â 10
3
km
2 )
(mg l
À 1
)
( Â 10
6 t y
À 1
)
( t k m
À 2
y
À 1
)
Amazon
6300
43
270
43
Yangtze (Changjiang)
1800
200
180
100
Ganges/Bramaputra
1650
130
150
91
Mississippi
3300
280
140
42
Irrawaddy
430
230
98
230
Salween
320
310
65
200
MacKenzie
1800
210
64
35
Parana/Uruguay
2800
92
62
22
St Lawrence
1200
180
62
52
Rhine
220
810
60
270
Cunene (Angola)
110
51
0.35
3
Torne (Norway)
39
30
0.37
9
Ems (Germany)
8
180
0.34
42
Citandy (Indonesia)
4.8
62
0.38
79
The first 10 rivers represent the highest dissolved loads of all world rivers, only the Amazon, Yangtze, Ganges/Brahmaputra, and
Mississippi rivers having annual loads >100 Â 10
6 t y
À1 . Discharges vary from 6300 (Amazon) to 74 Â km
3 y
À1 (Rhine), and basin
areas from 6300 (Amazon) to 220 Â 10
3 km
2 (Rhine). Corresponding average dissolved concentrations and yields vary from 43 to 810
and 43 to 270, respectively. The bottom rivers have similar annual dissolved loads (0.34–0.38 Â 10
6 t y
À1 ), but their average sediment
concentrations and yields vary by factors of 6–26 (respectively), reflecting both natural and anthropogenic influences.
462 RIVER INPUTS