

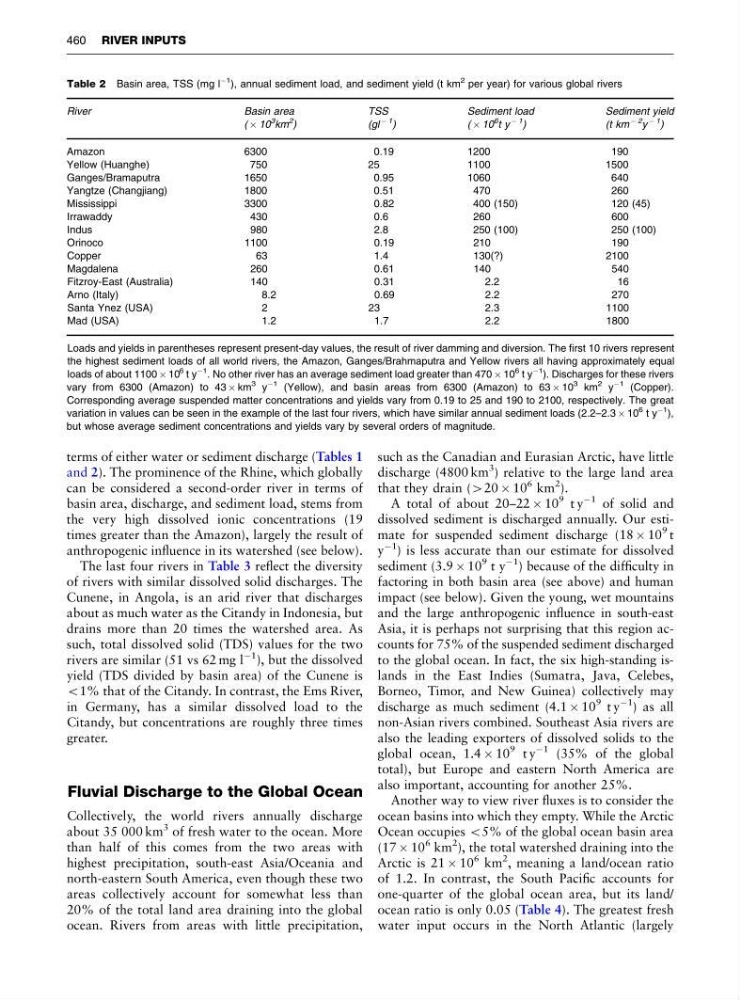
terms of either water or sediment discharge (Tables 1
and 2). The prominence of the Rhine, which globally
can be considered a second-order river in terms of
basin area, discharge, and sediment load, stems from
the very high dissolved ionic concentrations (19
times greater than the Amazon), largely the result of
anthropogenic influence in its watershed (see below).
The last four rivers in Table 3 reflect the diversity
of rivers with similar dissolved solid discharges. The
Cunene, in Angola, is an arid river that discharges
about as much water as the Citandy in Indonesia, but
drains more than 20 times the watershed area. As
such, total dissolved solid (TDS) values for the two
rivers are similar (51 vs 62 mg l
À1 ), but the dissolved
yield (TDS divided by basin area) of the Cunene is
o1% that of the Citandy. In contrast, the Ems River,
in Germany, has a similar dissolved load to the
Citandy, but concentrations are roughly three times
greater.
Fluvial Discharge to the Global Ocean
Collectively, the world rivers annually discharge
about 35 000 km
3 of fresh water to the ocean. More
than half of this comes from the two areas with
highest precipitation, south-east Asia/Oceania and
north-eastern South America, even though these two
areas collectively account for somewhat less than
20% of the total land area draining into the global
ocean. Rivers from areas with little precipitation,
such as the Canadian and Eurasian Arctic, have little
discharge (4800 km
3
) relative to the large land area
that they drain (420 Â 10
6 km
2
).
A total of about 20–22 Â 10
9 t y
À1 of solid and
dissolved sediment is discharged annually. Our estimate for suspended sediment discharge (18 Â 10
9 t
y
À1
) is less accurate than our estimate for dissolved
sediment (3.9 Â 10
9 t y
À1
) because of the difficulty in
factoring in both basin area (see above) and human
impact (see below). Given the young, wet mountains
and the large anthropogenic influence in south-east
Asia, it is perhaps not surprising that this region accounts for 75% of the suspended sediment discharged
to the global ocean. In fact, the six high-standing islands in the East Indies (Sumatra, Java, Celebes,
Borneo, Timor, and New Guinea) collectively may
discharge as much sediment (4.1 Â 10
9 t y
À1
) as all
non-Asian rivers combined. Southeast Asia rivers are
also the leading exporters of dissolved solids to the
global ocean, 1.4 Â 10
9 t y
À1 (35% of the global
total), but Europe and eastern North America are
also important, accounting for another 25%.
Another way to view river fluxes is to consider the
ocean basins into which they empty. While the Arctic
Ocean occupies o5% of the global ocean basin area
(17 Â 10
6 km
2
), the total watershed draining into the
Arctic is 21 Â 10
6 km
2
, meaning a land/ocean ratio
of 1.2. In contrast, the South Pacific accounts for
one-quarter of the global ocean area, but its land/
ocean ratio is only 0.05 (Table 4). The greatest fresh
water input occurs in the North Atlantic (largely
Table 2 Basin area, TSS (mg l
À1 ), annual sediment load, and sediment yield (t km
2 per year) for various global rivers
River
Basin area
TSS
Sediment load
Sediment yield
( Â 10
3
km
2 )
(gl
À 1
)
( Â 10
6 t y
À 1
)
( t k m
À 2
y
À 1
)
Amazon
6300
0.19
1200
190
Yellow (Huanghe)
750
25
1100
1500
Ganges/Bramaputra
1650
0.95
1060
640
Yangtze (Changjiang)
1800
0.51
470
260
Mississippi
3300
0.82
400 (150)
120 (45)
Irrawaddy
430
0.6
260
600
Indus
980
2.8
250 (100)
250 (100)
Orinoco
1100
0.19
210
190
Copper
63
1.4
130(?)
2100
Magdalena
260
0.61
140
540
Fitzroy-East (Australia)
140
0.31
2.2
16
Arno (Italy)
8.2
0.69
2.2
270
Santa Ynez (USA)
2
23
2.3
1100
Mad (USA)
1.2
1.7
2.2
1800
Loads and yields in parentheses represent present-day values, the result of river damming and diversion. The first 10 rivers represent
the highest sediment loads of all world rivers, the Amazon, Ganges/Brahmaputra and Yellow rivers all having approximately equal
loads of about 1100 Â 10
6 t y
À1 . No other river has an average sediment load greater than 470 Â 10
6 t y
À1
). Discharges for these rivers
vary from 6300 (Amazon) to 43 Â km
3 y
À1 (Yellow), and basin areas from 6300 (Amazon) to 63 Â 10
3 km
2 y
À1 (Copper).
Corresponding average suspended matter concentrations and yields vary from 0.19 to 25 and 190 to 2100, respectively. The great
variation in values can be seen in the example of the last four rivers, which have similar annual sediment loads (2.2–2.3 Â 10
6 t y
À1 ),
but whose average sediment concentrations and yields vary by several orders of magnitude.
460 RIVER INPUTS
and 2). The prominence of the Rhine, which globally
can be considered a second-order river in terms of
basin area, discharge, and sediment load, stems from
the very high dissolved ionic concentrations (19
times greater than the Amazon), largely the result of
anthropogenic influence in its watershed (see below).
The last four rivers in Table 3 reflect the diversity
of rivers with similar dissolved solid discharges. The
Cunene, in Angola, is an arid river that discharges
about as much water as the Citandy in Indonesia, but
drains more than 20 times the watershed area. As
such, total dissolved solid (TDS) values for the two
rivers are similar (51 vs 62 mg l
À1 ), but the dissolved
yield (TDS divided by basin area) of the Cunene is
o1% that of the Citandy. In contrast, the Ems River,
in Germany, has a similar dissolved load to the
Citandy, but concentrations are roughly three times
greater.
Fluvial Discharge to the Global Ocean
Collectively, the world rivers annually discharge
about 35 000 km
3 of fresh water to the ocean. More
than half of this comes from the two areas with
highest precipitation, south-east Asia/Oceania and
north-eastern South America, even though these two
areas collectively account for somewhat less than
20% of the total land area draining into the global
ocean. Rivers from areas with little precipitation,
such as the Canadian and Eurasian Arctic, have little
discharge (4800 km
3
) relative to the large land area
that they drain (420 Â 10
6 km
2
).
A total of about 20–22 Â 10
9 t y
À1 of solid and
dissolved sediment is discharged annually. Our estimate for suspended sediment discharge (18 Â 10
9 t
y
À1
) is less accurate than our estimate for dissolved
sediment (3.9 Â 10
9 t y
À1
) because of the difficulty in
factoring in both basin area (see above) and human
impact (see below). Given the young, wet mountains
and the large anthropogenic influence in south-east
Asia, it is perhaps not surprising that this region accounts for 75% of the suspended sediment discharged
to the global ocean. In fact, the six high-standing islands in the East Indies (Sumatra, Java, Celebes,
Borneo, Timor, and New Guinea) collectively may
discharge as much sediment (4.1 Â 10
9 t y
À1
) as all
non-Asian rivers combined. Southeast Asia rivers are
also the leading exporters of dissolved solids to the
global ocean, 1.4 Â 10
9 t y
À1 (35% of the global
total), but Europe and eastern North America are
also important, accounting for another 25%.
Another way to view river fluxes is to consider the
ocean basins into which they empty. While the Arctic
Ocean occupies o5% of the global ocean basin area
(17 Â 10
6 km
2
), the total watershed draining into the
Arctic is 21 Â 10
6 km
2
, meaning a land/ocean ratio
of 1.2. In contrast, the South Pacific accounts for
one-quarter of the global ocean area, but its land/
ocean ratio is only 0.05 (Table 4). The greatest fresh
water input occurs in the North Atlantic (largely
Table 2 Basin area, TSS (mg l
À1 ), annual sediment load, and sediment yield (t km
2 per year) for various global rivers
River
Basin area
TSS
Sediment load
Sediment yield
( Â 10
3
km
2 )
(gl
À 1
)
( Â 10
6 t y
À 1
)
( t k m
À 2
y
À 1
)
Amazon
6300
0.19
1200
190
Yellow (Huanghe)
750
25
1100
1500
Ganges/Bramaputra
1650
0.95
1060
640
Yangtze (Changjiang)
1800
0.51
470
260
Mississippi
3300
0.82
400 (150)
120 (45)
Irrawaddy
430
0.6
260
600
Indus
980
2.8
250 (100)
250 (100)
Orinoco
1100
0.19
210
190
Copper
63
1.4
130(?)
2100
Magdalena
260
0.61
140
540
Fitzroy-East (Australia)
140
0.31
2.2
16
Arno (Italy)
8.2
0.69
2.2
270
Santa Ynez (USA)
2
23
2.3
1100
Mad (USA)
1.2
1.7
2.2
1800
Loads and yields in parentheses represent present-day values, the result of river damming and diversion. The first 10 rivers represent
the highest sediment loads of all world rivers, the Amazon, Ganges/Brahmaputra and Yellow rivers all having approximately equal
loads of about 1100 Â 10
6 t y
À1 . No other river has an average sediment load greater than 470 Â 10
6 t y
À1
). Discharges for these rivers
vary from 6300 (Amazon) to 43 Â km
3 y
À1 (Yellow), and basin areas from 6300 (Amazon) to 63 Â 10
3 km
2 y
À1 (Copper).
Corresponding average suspended matter concentrations and yields vary from 0.19 to 25 and 190 to 2100, respectively. The great
variation in values can be seen in the example of the last four rivers, which have similar annual sediment loads (2.2–2.3 Â 10
6 t y
À1 ),
but whose average sediment concentrations and yields vary by several orders of magnitude.
460 RIVER INPUTS