

electron acceptors. CH 2 O is oxidized to CO 2 (converted to HCO 3
À in the marine environment) and
NH 3 to NO 3
À (oxidation by O 2 ), N 2 (oxidation by
NO 3
À ), or NH 4
þ (Mn(IV), Fe(III), S(VI)). The result is
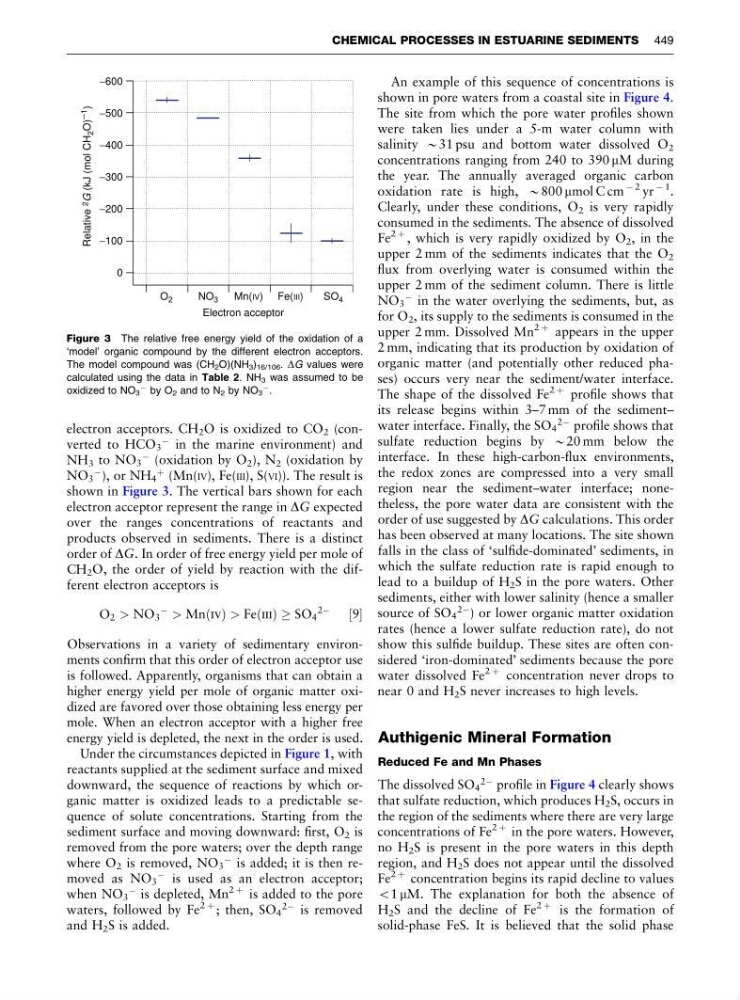
shown in Figure 3. The vertical bars shown for each
electron acceptor represent the range in DG expected
over the ranges concentrations of reactants and
products observed in sediments. There is a distinct
order of DG. In order of free energy yield per mole of
CH 2 O, the order of yield by reaction with the different electron acceptors is
O 2 > NO 3
À > MnðivÞ > FeðiiiÞ ! SO 4
2À
½9
Observations in a variety of sedimentary environments confirm that this order of electron acceptor use
is followed. Apparently, organisms that can obtain a
higher energy yield per mole of organic matter oxidized are favored over those obtaining less energy per
mole. When an electron acceptor with a higher free
energy yield is depleted, the next in the order is used.
Under the circumstances depicted in Figure 1, with
reactants supplied at the sediment surface and mixed
downward, the sequence of reactions by which organic matter is oxidized leads to a predictable sequence of solute concentrations. Starting from the
sediment surface and moving downward: first, O 2 is
removed from the pore waters; over the depth range
where O 2 is removed, NO 3
À is added; it is then removed as NO 3
À is used as an electron acceptor;
when NO 3
À is depleted, Mn
2 þ is added to the pore
waters, followed by Fe
2 þ ; then, SO 4
2À is removed
and H 2 S is added.
An example of this sequence of concentrations is
shown in pore waters from a coastal site in Figure 4.
The site from which the pore water profiles shown
were taken lies under a 5-m water column with
salinity B31 psu and bottom water dissolved O 2
concentrations ranging from 240 to 390 mM during
the year. The annually averaged organic carbon
oxidation rate is high, B800 mmol C cm
À 2 yr
À 1
.
Clearly, under these conditions, O 2 is very rapidly
consumed in the sediments. The absence of dissolved
Fe
2 þ , which is very rapidly oxidized by O 2 , in the
upper 2 mm of the sediments indicates that the O 2
flux from overlying water is consumed within the
upper 2 mm of the sediment column. There is little
NO 3
À in the water overlying the sediments, but, as
for O 2 , its supply to the sediments is consumed in the
upper 2 mm. Dissolved Mn
2 þ appears in the upper
2 mm, indicating that its production by oxidation of
organic matter (and potentially other reduced phases) occurs very near the sediment/water interface.
The shape of the dissolved Fe
2 þ profile shows that
its release begins within 3–7 mm of the sediment–
water interface. Finally, the SO 4
2À profile shows that
sulfate reduction begins by B20 mm below the
interface. In these high-carbon-flux environments,
the redox zones are compressed into a very small
region near the sediment–water interface; nonetheless, the pore water data are consistent with the
order of use suggested by DG calculations. This order
has been observed at many locations. The site shown
falls in the class of ‘sulfide-dominated’ sediments, in
which the sulfate reduction rate is rapid enough to
lead to a buildup of H 2 S in the pore waters. Other
sediments, either with lower salinity (hence a smaller
source of SO 4
2À ) or lower organic matter oxidation
rates (hence a lower sulfate reduction rate), do not
show this sulfide buildup. These sites are often considered ‘iron-dominated’ sediments because the pore
water dissolved Fe
2 þ concentration never drops to
near 0 and H 2 S never increases to high levels.
Authigenic Mineral Formation
Reduced Fe and Mn Phases
The dissolved SO 4
2À profile in Figure 4 clearly shows
that sulfate reduction, which produces H 2 S, occurs in
the region of the sediments where there are very large
concentrations of Fe
2 þ in the pore waters. However,
no H 2 S is present in the pore waters in this depth
region, and H 2 S does not appear until the dissolved
Fe
2 þ concentration begins its rapid decline to values
o1 mM. The explanation for both the absence of
H 2 S and the decline of Fe
2 þ is the formation of
solid-phase FeS. It is believed that the solid phase
−600
−500
−400
−300
−200
−100
0
Relative 2
G (kJ (mol CH
2 O) −1
)
O 2
NO 3
Mn(IV) Fe(III)
SO 4
Electron acceptor
Figure 3 The relative free energy yield of the oxidation of a
‘model’ organic compound by the different electron acceptors.
The model compound was (CH 2 O)(NH 3 ) 16/106 . DG values were
calculated using the data in Table 2. NH 3 was assumed to be
oxidized to NO 3
À by O 2 and to N 2 by NO 3
À .
CHEMICAL PROCESSES IN ESTUARINE SEDIMENTS 449
À in the marine environment) and
NH 3 to NO 3
À (oxidation by O 2 ), N 2 (oxidation by
NO 3
À ), or NH 4
þ (Mn(IV), Fe(III), S(VI)). The result is
shown in Figure 3. The vertical bars shown for each
electron acceptor represent the range in DG expected
over the ranges concentrations of reactants and
products observed in sediments. There is a distinct
order of DG. In order of free energy yield per mole of
CH 2 O, the order of yield by reaction with the different electron acceptors is
O 2 > NO 3
À > MnðivÞ > FeðiiiÞ ! SO 4
2À
½9
Observations in a variety of sedimentary environments confirm that this order of electron acceptor use
is followed. Apparently, organisms that can obtain a
higher energy yield per mole of organic matter oxidized are favored over those obtaining less energy per
mole. When an electron acceptor with a higher free
energy yield is depleted, the next in the order is used.
Under the circumstances depicted in Figure 1, with
reactants supplied at the sediment surface and mixed
downward, the sequence of reactions by which organic matter is oxidized leads to a predictable sequence of solute concentrations. Starting from the
sediment surface and moving downward: first, O 2 is
removed from the pore waters; over the depth range
where O 2 is removed, NO 3
À is added; it is then removed as NO 3
À is used as an electron acceptor;
when NO 3
À is depleted, Mn
2 þ is added to the pore
waters, followed by Fe
2 þ ; then, SO 4
2À is removed
and H 2 S is added.
An example of this sequence of concentrations is
shown in pore waters from a coastal site in Figure 4.
The site from which the pore water profiles shown
were taken lies under a 5-m water column with
salinity B31 psu and bottom water dissolved O 2
concentrations ranging from 240 to 390 mM during
the year. The annually averaged organic carbon
oxidation rate is high, B800 mmol C cm
À 2 yr
À 1
.
Clearly, under these conditions, O 2 is very rapidly
consumed in the sediments. The absence of dissolved
Fe
2 þ , which is very rapidly oxidized by O 2 , in the
upper 2 mm of the sediments indicates that the O 2
flux from overlying water is consumed within the
upper 2 mm of the sediment column. There is little
NO 3
À in the water overlying the sediments, but, as
for O 2 , its supply to the sediments is consumed in the
upper 2 mm. Dissolved Mn
2 þ appears in the upper
2 mm, indicating that its production by oxidation of
organic matter (and potentially other reduced phases) occurs very near the sediment/water interface.
The shape of the dissolved Fe
2 þ profile shows that
its release begins within 3–7 mm of the sediment–
water interface. Finally, the SO 4
2À profile shows that
sulfate reduction begins by B20 mm below the
interface. In these high-carbon-flux environments,
the redox zones are compressed into a very small
region near the sediment–water interface; nonetheless, the pore water data are consistent with the
order of use suggested by DG calculations. This order
has been observed at many locations. The site shown
falls in the class of ‘sulfide-dominated’ sediments, in
which the sulfate reduction rate is rapid enough to
lead to a buildup of H 2 S in the pore waters. Other
sediments, either with lower salinity (hence a smaller
source of SO 4
2À ) or lower organic matter oxidation
rates (hence a lower sulfate reduction rate), do not
show this sulfide buildup. These sites are often considered ‘iron-dominated’ sediments because the pore
water dissolved Fe
2 þ concentration never drops to
near 0 and H 2 S never increases to high levels.
Authigenic Mineral Formation
Reduced Fe and Mn Phases
The dissolved SO 4
2À profile in Figure 4 clearly shows
that sulfate reduction, which produces H 2 S, occurs in
the region of the sediments where there are very large
concentrations of Fe
2 þ in the pore waters. However,
no H 2 S is present in the pore waters in this depth
region, and H 2 S does not appear until the dissolved
Fe
2 þ concentration begins its rapid decline to values
o1 mM. The explanation for both the absence of
H 2 S and the decline of Fe
2 þ is the formation of
solid-phase FeS. It is believed that the solid phase
−600
−500
−400
−300
−200
−100
0
Relative 2
G (kJ (mol CH
2 O) −1
)
O 2
NO 3
Mn(IV) Fe(III)
SO 4
Electron acceptor
Figure 3 The relative free energy yield of the oxidation of a
‘model’ organic compound by the different electron acceptors.
The model compound was (CH 2 O)(NH 3 ) 16/106 . DG values were
calculated using the data in Table 2. NH 3 was assumed to be
oxidized to NO 3
À by O 2 and to N 2 by NO 3
À .
CHEMICAL PROCESSES IN ESTUARINE SEDIMENTS 449