

pe(sw) is often used because the difference between
this calculation (2) and pe (3) is often small.
pe
0 , pe(sw), and pe values are listed in Table 2 for
the electron acceptors and donors in Table 1, and
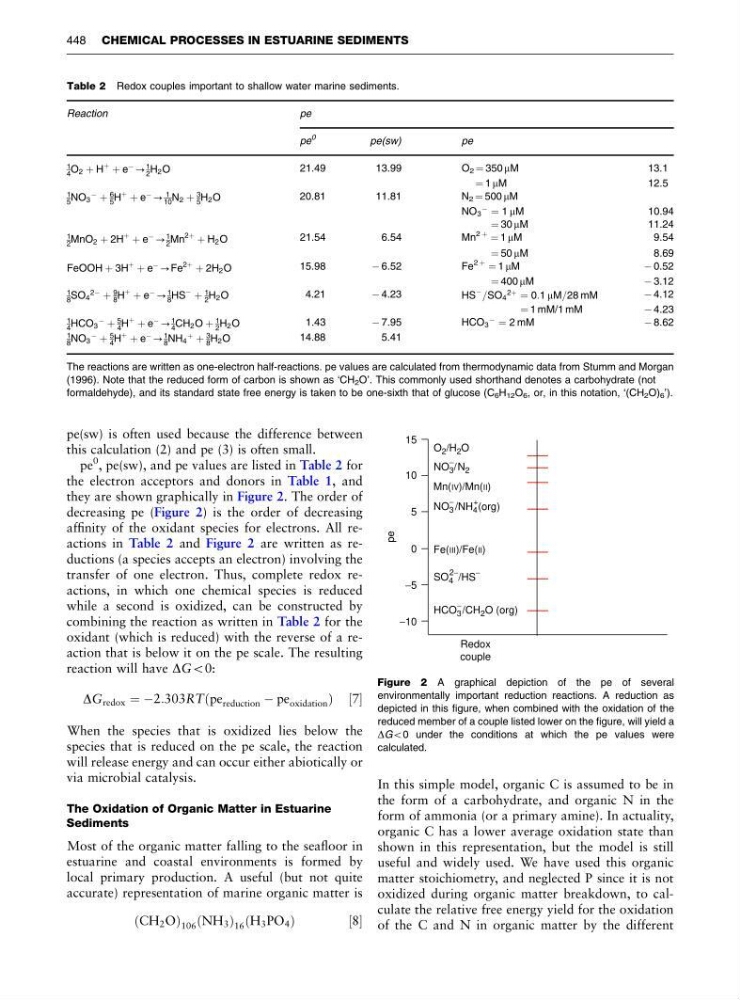
they are shown graphically in Figure 2. The order of
decreasing pe (Figure 2) is the order of decreasing
affinity of the oxidant species for electrons. All reactions in Table 2 and Figure 2 are written as reductions (a species accepts an electron) involving the
transfer of one electron. Thus, complete redox reactions, in which one chemical species is reduced
while a second is oxidized, can be constructed by
combining the reaction as written in Table 2 for the
oxidant (which is reduced) with the reverse of a reaction that is below it on the pe scale. The resulting
reaction will have DGo0:
DG redox ¼ À2:303RT pe reduction À pe oxidation
ð
Þ ½ 7
When the species that is oxidized lies below the
species that is reduced on the pe scale, the reaction
will release energy and can occur either abiotically or
via microbial catalysis.
The Oxidation of Organic Matter in Estuarine
Sediments
Most of the organic matter falling to the seafloor in
estuarine and coastal environments is formed by
local primary production. A useful (but not quite
accurate) representation of marine organic matter is
CH 2 O
ð
Þ 106 NH 3
ð
Þ 16 H 3 PO 4
ð
Þ
½ 8
In this simple model, organic C is assumed to be in
the form of a carbohydrate, and organic N in the
form of ammonia (or a primary amine). In actuality,
organic C has a lower average oxidation state than
shown in this representation, but the model is still
useful and widely used. We have used this organic
matter stoichiometry, and neglected P since it is not
oxidized during organic matter breakdown, to calculate the relative free energy yield for the oxidation
of the C and N in organic matter by the different
Table 2 Redox couples important to shallow water marine sediments.
Reaction
pe
pe
0
pe(sw)
pe
1
4 O 2 þ H
þ þ e
À -
1
2 H 2 O
21.49
13.99
O 2 ¼ 350 mM
13.1
¼ 1 mM
12.5
1
5 NO 3
À þ
6
5 H
þ þ e
À -
1
10 N 2 þ
3
5 H 2 O
20.81
11.81
N 2 ¼ 500 mM
NO 3
À ¼ 1 mM
10.94
¼ 30 mM
11.24
1
2 MnO 2 þ 2H
þ þ e
À -
1
2 Mn
2þ þ H 2 O
21.54
6.54
Mn
2 þ ¼ 1 mM
9.54
¼ 50 mM
8.69
FeOOH þ 3H
þ þ e
À -Fe
2þ þ 2H 2 O
15.98
À 6.52
Fe
2 þ ¼ 1 mM
À 0.52
¼ 400 mM
À 3.12
1
8 SO 4
2À þ
9
8 H
þ þ e
À -
1
8 HS
À þ
1
2 H 2 O
4.21
À 4.23
HS
À =SO 4
2þ ¼ 0:1 mM=28 mM
À 4.12
¼ 1 mM/1 mM
À 4.23
1
4 HCO 3
À þ
5
4 H
þ þ e
À -
1
4 CH 2 O þ
1
2 H 2 O
1.43
À 7.95
HCO 3
À ¼ 2 mM
À 8.62
1
8 NO 3
À þ
5
4 H
þ þ e
À -
1
8 NH 4
þ þ
3
8 H 2 O
14.88
5.41
The reactions are written as one-electron half-reactions. pe values are calculated from thermodynamic data from Stumm and Morgan
(1996). Note that the reduced form of carbon is shown as ‘CH 2 O’. This commonly used shorthand denotes a carbohydrate (not
formaldehyde), and its standard state free energy is taken to be one-sixth that of glucose (C 6 H 12 O 6 , or, in this notation, ‘(CH 2 O) 6 ’).
15
10
5
0
−5
−10
pe
O 2 /H 2 O
NO 3
− /N 2
Mn(IV)/Mn(II)
NO 3
− /NH 4
+
(org)
Fe(III)/Fe(II)
SO 4
2− /HS
−
HCO 3
− /CH 2 O (org)
Redox
couple
Figure 2 A graphical depiction of the pe of several
environmentally important reduction reactions. A reduction as
depicted in this figure, when combined with the oxidation of the
reduced member of a couple listed lower on the figure, will yield a
DGo0 under the conditions at which the pe values were
calculated.
448 CHEMICAL PROCESSES IN ESTUARINE SEDIMENTS
this calculation (2) and pe (3) is often small.
pe
0 , pe(sw), and pe values are listed in Table 2 for
the electron acceptors and donors in Table 1, and
they are shown graphically in Figure 2. The order of
decreasing pe (Figure 2) is the order of decreasing
affinity of the oxidant species for electrons. All reactions in Table 2 and Figure 2 are written as reductions (a species accepts an electron) involving the
transfer of one electron. Thus, complete redox reactions, in which one chemical species is reduced
while a second is oxidized, can be constructed by
combining the reaction as written in Table 2 for the
oxidant (which is reduced) with the reverse of a reaction that is below it on the pe scale. The resulting
reaction will have DGo0:
DG redox ¼ À2:303RT pe reduction À pe oxidation
ð
Þ ½ 7
When the species that is oxidized lies below the
species that is reduced on the pe scale, the reaction
will release energy and can occur either abiotically or
via microbial catalysis.
The Oxidation of Organic Matter in Estuarine
Sediments
Most of the organic matter falling to the seafloor in
estuarine and coastal environments is formed by
local primary production. A useful (but not quite
accurate) representation of marine organic matter is
CH 2 O
ð
Þ 106 NH 3
ð
Þ 16 H 3 PO 4
ð
Þ
½ 8
In this simple model, organic C is assumed to be in
the form of a carbohydrate, and organic N in the
form of ammonia (or a primary amine). In actuality,
organic C has a lower average oxidation state than
shown in this representation, but the model is still
useful and widely used. We have used this organic
matter stoichiometry, and neglected P since it is not
oxidized during organic matter breakdown, to calculate the relative free energy yield for the oxidation
of the C and N in organic matter by the different
Table 2 Redox couples important to shallow water marine sediments.
Reaction
pe
pe
0
pe(sw)
pe
1
4 O 2 þ H
þ þ e
À -
1
2 H 2 O
21.49
13.99
O 2 ¼ 350 mM
13.1
¼ 1 mM
12.5
1
5 NO 3
À þ
6
5 H
þ þ e
À -
1
10 N 2 þ
3
5 H 2 O
20.81
11.81
N 2 ¼ 500 mM
NO 3
À ¼ 1 mM
10.94
¼ 30 mM
11.24
1
2 MnO 2 þ 2H
þ þ e
À -
1
2 Mn
2þ þ H 2 O
21.54
6.54
Mn
2 þ ¼ 1 mM
9.54
¼ 50 mM
8.69
FeOOH þ 3H
þ þ e
À -Fe
2þ þ 2H 2 O
15.98
À 6.52
Fe
2 þ ¼ 1 mM
À 0.52
¼ 400 mM
À 3.12
1
8 SO 4
2À þ
9
8 H
þ þ e
À -
1
8 HS
À þ
1
2 H 2 O
4.21
À 4.23
HS
À =SO 4
2þ ¼ 0:1 mM=28 mM
À 4.12
¼ 1 mM/1 mM
À 4.23
1
4 HCO 3
À þ
5
4 H
þ þ e
À -
1
4 CH 2 O þ
1
2 H 2 O
1.43
À 7.95
HCO 3
À ¼ 2 mM
À 8.62
1
8 NO 3
À þ
5
4 H
þ þ e
À -
1
8 NH 4
þ þ
3
8 H 2 O
14.88
5.41
The reactions are written as one-electron half-reactions. pe values are calculated from thermodynamic data from Stumm and Morgan
(1996). Note that the reduced form of carbon is shown as ‘CH 2 O’. This commonly used shorthand denotes a carbohydrate (not
formaldehyde), and its standard state free energy is taken to be one-sixth that of glucose (C 6 H 12 O 6 , or, in this notation, ‘(CH 2 O) 6 ’).
15
10
5
0
−5
−10
pe
O 2 /H 2 O
NO 3
− /N 2
Mn(IV)/Mn(II)
NO 3
− /NH 4
+
(org)
Fe(III)/Fe(II)
SO 4
2− /HS
−
HCO 3
− /CH 2 O (org)
Redox
couple
Figure 2 A graphical depiction of the pe of several
environmentally important reduction reactions. A reduction as
depicted in this figure, when combined with the oxidation of the
reduced member of a couple listed lower on the figure, will yield a
DGo0 under the conditions at which the pe values were
calculated.
448 CHEMICAL PROCESSES IN ESTUARINE SEDIMENTS