

in the ocean. At any one time, the volume of water
being transported through the hydrologic cycle (e.g.,
atmosphere, lakes, rivers, and groundwater) is small
compared to the volume of water in the oceans
(1:130). Therefore, the hydrologic cycle can influence the whole ocean d
18 O water value only by creating a new or enlarging an existing reservoir (e.g.,
glacier/ice sheets). In contrast, evaporation/precipitation processes will change the d
18 O water and salinity values in the surface waters because only the
thin surface layer of the ocean communicates with
the atmosphere. As noted above, the process of
evaporation enriches surface water in H 2
18 O molecules and salt because the water vapor is enriched in
H 2
16 O molecules. For this reason, high salinity sea
water has a high d
18 O water value and vice versa.
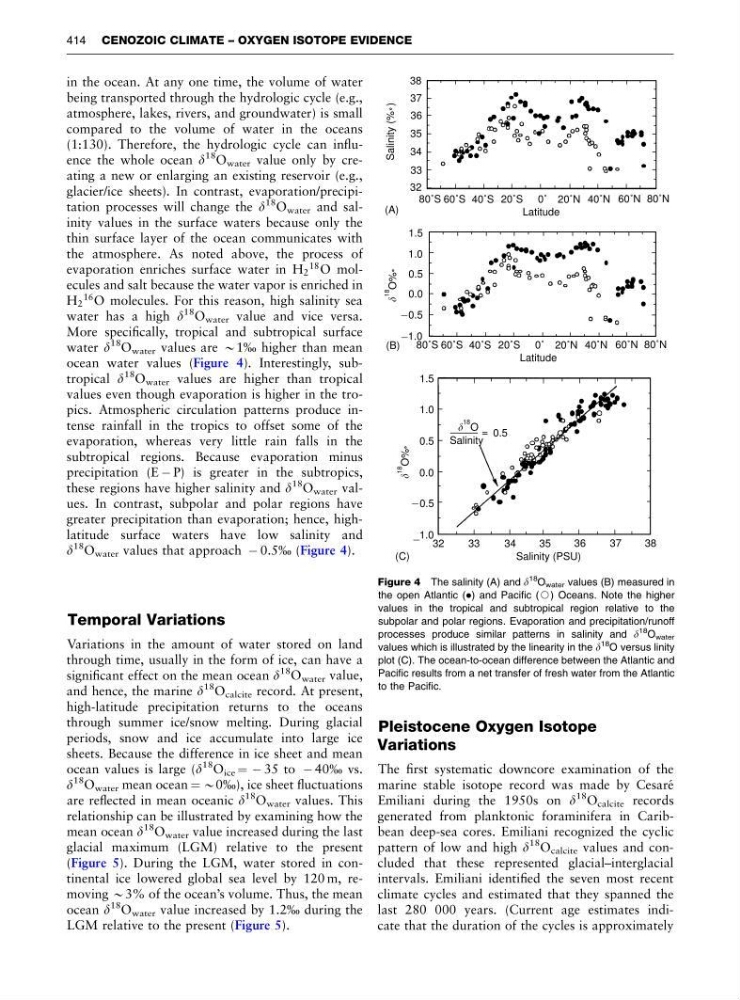
More specifically, tropical and subtropical surface
water d
18
O water values are B1% higher than mean
ocean water values (Figure 4). Interestingly, subtropical d
18
O water values are higher than tropical
values even though evaporation is higher in the tropics. Atmospheric circulation patterns produce intense rainfall in the tropics to offset some of the
evaporation, whereas very little rain falls in the
subtropical regions. Because evaporation minus
precipitation (E À P) is greater in the subtropics,
these regions have higher salinity and d
18
O water values. In contrast, subpolar and polar regions have
greater precipitation than evaporation; hence, highlatitude surface waters have low salinity and
d
18 O water values that approach À 0.5% (Figure 4).
Temporal Variations
Variations in the amount of water stored on land
through time, usually in the form of ice, can have a
significant effect on the mean ocean d
18 O water value,
and hence, the marine d
18 O calcite record. At present,
high-latitude precipitation returns to the oceans
through summer ice/snow melting. During glacial
periods, snow and ice accumulate into large ice
sheets. Because the difference in ice sheet and mean
ocean values is large (d
18
O ice ¼ À 35 to À 40% vs.
d
18 O water mean ocean ¼ B0%), ice sheet fluctuations
are reflected in mean oceanic d
18
O water values. This
relationship can be illustrated by examining how the
mean ocean d
18 O water value increased during the last
glacial maximum (LGM) relative to the present
(Figure 5). During the LGM, water stored in continental ice lowered global sea level by 120 m, removing B3% of the ocean’s volume. Thus, the mean
ocean d
18 O water value increased by 1.2% during the
LGM relative to the present (Figure 5).
Pleistocene Oxygen Isotope
Variations
The first systematic downcore examination of the
marine stable isotope record was made by Cesare ´
Emiliani during the 1950s on d
18 O calcite records
generated from planktonic foraminifera in Caribbean deep-sea cores. Emiliani recognized the cyclic
pattern of low and high d
18 O calcite values and concluded that these represented glacial–interglacial
intervals. Emiliani identified the seven most recent
climate cycles and estimated that they spanned the
last 280 000 years. (Current age estimates indicate that the duration of the cycles is approximately
38
37
36
35
34
33
32
Salinity (% )
˚
80˚S 60˚S 40˚S 20˚S
20˚N 40˚N 60˚N 80˚N
0˚
Latitude
(A)
80˚S 60˚S 40˚S 20˚S
20˚N 40˚N 60˚N 80˚N
0˚
Latitude
1.5
1.0
0.5
0.0
_ 0.5
_ 1.0
18
O%
˚
(B)
1.5
1.0
0.5
0.0
_ 0.5
_1.0
32
33
34
35
36
37
38
Salinity (PSU)
18
O%
˚
18 O
Salinity
0.5
=
(C)
Figure 4 The salinity (A) and d
18
O water values (B) measured in
the open Atlantic () and Pacific (J) Oceans. Note the higher
values in the tropical and subtropical region relative to the
subpolar and polar regions. Evaporation and precipitation/runoff
processes produce similar patterns in salinity and d
18 O water
values which is illustrated by the linearity in the d
18 O versus linity
plot (C). The ocean-to-ocean difference between the Atlantic and
Pacific results from a net transfer of fresh water from the Atlantic
to the Pacific.
414 CENOZOIC CLIMATE – OXYGEN ISOTOPE EVIDENCE
being transported through the hydrologic cycle (e.g.,
atmosphere, lakes, rivers, and groundwater) is small
compared to the volume of water in the oceans
(1:130). Therefore, the hydrologic cycle can influence the whole ocean d
18 O water value only by creating a new or enlarging an existing reservoir (e.g.,
glacier/ice sheets). In contrast, evaporation/precipitation processes will change the d
18 O water and salinity values in the surface waters because only the
thin surface layer of the ocean communicates with
the atmosphere. As noted above, the process of
evaporation enriches surface water in H 2
18 O molecules and salt because the water vapor is enriched in
H 2
16 O molecules. For this reason, high salinity sea
water has a high d
18 O water value and vice versa.
More specifically, tropical and subtropical surface
water d
18
O water values are B1% higher than mean
ocean water values (Figure 4). Interestingly, subtropical d
18
O water values are higher than tropical
values even though evaporation is higher in the tropics. Atmospheric circulation patterns produce intense rainfall in the tropics to offset some of the
evaporation, whereas very little rain falls in the
subtropical regions. Because evaporation minus
precipitation (E À P) is greater in the subtropics,
these regions have higher salinity and d
18
O water values. In contrast, subpolar and polar regions have
greater precipitation than evaporation; hence, highlatitude surface waters have low salinity and
d
18 O water values that approach À 0.5% (Figure 4).
Temporal Variations
Variations in the amount of water stored on land
through time, usually in the form of ice, can have a
significant effect on the mean ocean d
18 O water value,
and hence, the marine d
18 O calcite record. At present,
high-latitude precipitation returns to the oceans
through summer ice/snow melting. During glacial
periods, snow and ice accumulate into large ice
sheets. Because the difference in ice sheet and mean
ocean values is large (d
18
O ice ¼ À 35 to À 40% vs.
d
18 O water mean ocean ¼ B0%), ice sheet fluctuations
are reflected in mean oceanic d
18
O water values. This
relationship can be illustrated by examining how the
mean ocean d
18 O water value increased during the last
glacial maximum (LGM) relative to the present
(Figure 5). During the LGM, water stored in continental ice lowered global sea level by 120 m, removing B3% of the ocean’s volume. Thus, the mean
ocean d
18 O water value increased by 1.2% during the
LGM relative to the present (Figure 5).
Pleistocene Oxygen Isotope
Variations
The first systematic downcore examination of the
marine stable isotope record was made by Cesare ´
Emiliani during the 1950s on d
18 O calcite records
generated from planktonic foraminifera in Caribbean deep-sea cores. Emiliani recognized the cyclic
pattern of low and high d
18 O calcite values and concluded that these represented glacial–interglacial
intervals. Emiliani identified the seven most recent
climate cycles and estimated that they spanned the
last 280 000 years. (Current age estimates indicate that the duration of the cycles is approximately
38
37
36
35
34
33
32
Salinity (% )
˚
80˚S 60˚S 40˚S 20˚S
20˚N 40˚N 60˚N 80˚N
0˚
Latitude
(A)
80˚S 60˚S 40˚S 20˚S
20˚N 40˚N 60˚N 80˚N
0˚
Latitude
1.5
1.0
0.5
0.0
_ 0.5
_ 1.0
18
O%
˚
(B)
1.5
1.0
0.5
0.0
_ 0.5
_1.0
32
33
34
35
36
37
38
Salinity (PSU)
18
O%
˚
18 O
Salinity
0.5
=
(C)
Figure 4 The salinity (A) and d
18
O water values (B) measured in
the open Atlantic () and Pacific (J) Oceans. Note the higher
values in the tropical and subtropical region relative to the
subpolar and polar regions. Evaporation and precipitation/runoff
processes produce similar patterns in salinity and d
18 O water
values which is illustrated by the linearity in the d
18 O versus linity
plot (C). The ocean-to-ocean difference between the Atlantic and
Pacific results from a net transfer of fresh water from the Atlantic
to the Pacific.
414 CENOZOIC CLIMATE – OXYGEN ISOTOPE EVIDENCE