

525 000 years.) To apply the paleotemperature
equation to these records, Emiliani estimated that ice
sheet-induced ocean d
18 O water variability was relatively small, 0.3%. (As shown above, the maximum
glacial–interglacial ice sheet signal was closer to
1.2%.) Therefore, most of the d
18 O calcite variability
between glacial and interglacial intervals represented
temperature changes of 5–101C. Emiliani divided the
d
18 O calcite record into warm stages (designated
with odd numbers counting down from the
Holocene) and cold stages (even numbers). Hence,
‘Isotope Stage 1’ refers to the present interglacial
interval and ‘Isotope Stage 2’ refers to the LGM
(Figure 6). During the 1960s and 1970s, many argued that most of the glacial to interglacial difference
in d
18 O calcite values resulted from ice volume changes. Nicholas Shackleton of Cambridge University
made the key observation that benthic foraminiferal
d
18 O values show a glacial to interglacial difference
of B1.8%. If the ice volume contribution was only
0.3% as argued by Emiliani, then the deep ocean
temperatures would have been 6–71C colder than the
present temperatures of 0–31C. Sea water freezes
at À 1.81C, precluding Emiliani’s ‘low’ ice volume
estimate. By the early 1970s, numerous d
18
O records
had been generated and showed a cyclic variation
through the Pleistocene and into the late Pliocene.
One hundred oxygen isotope stages, representing
50 glacial–interglacial cycles, have been identified for
the interval since 2.6 million years ago (Ma)
(Figure 6).
Cenozoic d
18
O Records
The first Cenozoic d
18
O syntheses based on foraminiferal d
18
O records were produced during the
mid-1970s. Nicholas Shackleton and James Kennett
produced a composite benthic d
18
O record for the
Cenozoic from cores to the south of Australia.
A second group led by Samuel Savin generated lowlatitude planktonic and benthic foraminiferal d
18
O
syntheses. Both records are important to understanding Cenozoic climate changes. Benthic foraminiferal records best reflect global temperature and
ice volume changes. Additional advantages of the
benthic foraminiferal composite include: (1) deepocean temperatures are more uniform with respect to
horizontal and vertical gradients; (2) deep-ocean
d
18
O water values are less variable compared to the
large surface water changes; (3) the deep ocean approximates high-latitude surface water conditions
where deep waters originated during the Cenozoic
(i.e., Antarctica, northern North Atlantic); and
(4) many benthic foraminifera taxa are long-lived so
that one species can be used to construct records
spanning several millions of years in contrast to
planktonic taxa which have shorter durations and
Present
20 000 y BP
Sea water
Sea water
O = 0.0%
18
˚
O = 1.2%
18
˚
Glacial ice
18 O = _ 40% ˚
ΔSea level = 120 m
120 m / 3800 m = 0.03
Δ
18
O
= 1.2%
˚
0.0 _ ( _ 40
0.03)
×
%
%
˚
˚
water
Mean depth of oceans
= 3800 m
18
O = 0.0% ˚
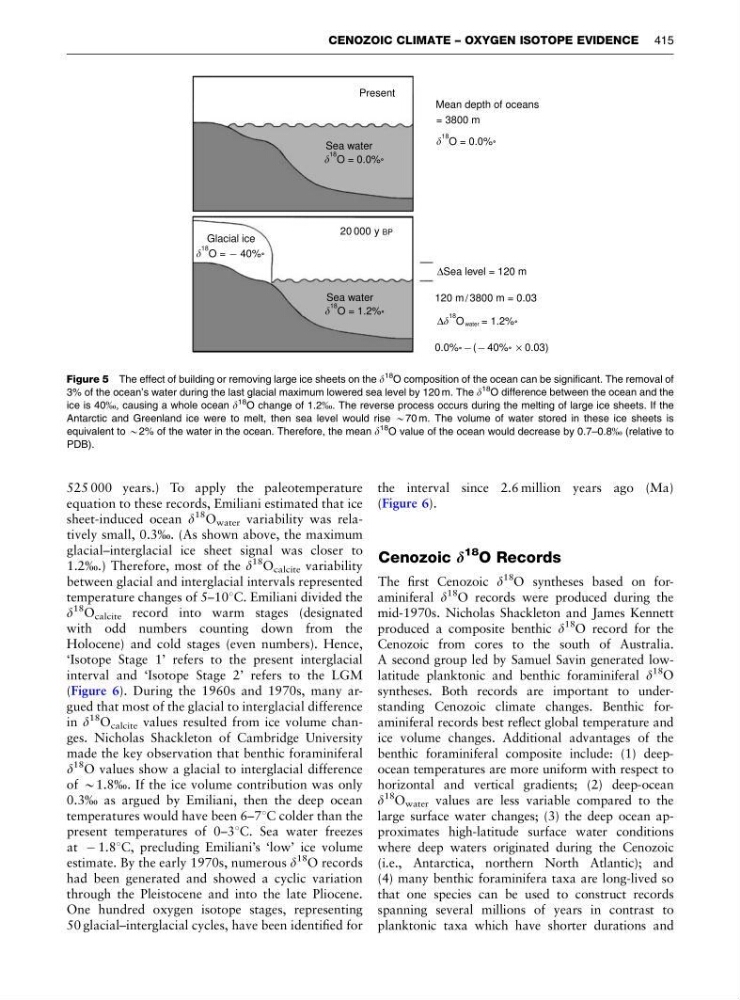
Figure 5 The effect of building or removing large ice sheets on the d
18 O composition of the ocean can be significant. The removal of
3% of the ocean’s water during the last glacial maximum lowered sea level by 120 m. The d
18 O difference between the ocean and the
ice is 40%, causing a whole ocean d
18 O change of 1.2%. The reverse process occurs during the melting of large ice sheets. If the
Antarctic and Greenland ice were to melt, then sea level would rise B70 m. The volume of water stored in these ice sheets is
equivalent to B2% of the water in the ocean. Therefore, the mean d
18 O value of the ocean would decrease by 0.7–0.8% (relative to
PDB).
CENOZOIC CLIMATE – OXYGEN ISOTOPE EVIDENCE 415
equation to these records, Emiliani estimated that ice
sheet-induced ocean d
18 O water variability was relatively small, 0.3%. (As shown above, the maximum
glacial–interglacial ice sheet signal was closer to
1.2%.) Therefore, most of the d
18 O calcite variability
between glacial and interglacial intervals represented
temperature changes of 5–101C. Emiliani divided the
d
18 O calcite record into warm stages (designated
with odd numbers counting down from the
Holocene) and cold stages (even numbers). Hence,
‘Isotope Stage 1’ refers to the present interglacial
interval and ‘Isotope Stage 2’ refers to the LGM
(Figure 6). During the 1960s and 1970s, many argued that most of the glacial to interglacial difference
in d
18 O calcite values resulted from ice volume changes. Nicholas Shackleton of Cambridge University
made the key observation that benthic foraminiferal
d
18 O values show a glacial to interglacial difference
of B1.8%. If the ice volume contribution was only
0.3% as argued by Emiliani, then the deep ocean
temperatures would have been 6–71C colder than the
present temperatures of 0–31C. Sea water freezes
at À 1.81C, precluding Emiliani’s ‘low’ ice volume
estimate. By the early 1970s, numerous d
18
O records
had been generated and showed a cyclic variation
through the Pleistocene and into the late Pliocene.
One hundred oxygen isotope stages, representing
50 glacial–interglacial cycles, have been identified for
the interval since 2.6 million years ago (Ma)
(Figure 6).
Cenozoic d
18
O Records
The first Cenozoic d
18
O syntheses based on foraminiferal d
18
O records were produced during the
mid-1970s. Nicholas Shackleton and James Kennett
produced a composite benthic d
18
O record for the
Cenozoic from cores to the south of Australia.
A second group led by Samuel Savin generated lowlatitude planktonic and benthic foraminiferal d
18
O
syntheses. Both records are important to understanding Cenozoic climate changes. Benthic foraminiferal records best reflect global temperature and
ice volume changes. Additional advantages of the
benthic foraminiferal composite include: (1) deepocean temperatures are more uniform with respect to
horizontal and vertical gradients; (2) deep-ocean
d
18
O water values are less variable compared to the
large surface water changes; (3) the deep ocean approximates high-latitude surface water conditions
where deep waters originated during the Cenozoic
(i.e., Antarctica, northern North Atlantic); and
(4) many benthic foraminifera taxa are long-lived so
that one species can be used to construct records
spanning several millions of years in contrast to
planktonic taxa which have shorter durations and
Present
20 000 y BP
Sea water
Sea water
O = 0.0%
18
˚
O = 1.2%
18
˚
Glacial ice
18 O = _ 40% ˚
ΔSea level = 120 m
120 m / 3800 m = 0.03
Δ
18
O
= 1.2%
˚
0.0 _ ( _ 40
0.03)
×
%
%
˚
˚
water
Mean depth of oceans
= 3800 m
18
O = 0.0% ˚
Figure 5 The effect of building or removing large ice sheets on the d
18 O composition of the ocean can be significant. The removal of
3% of the ocean’s water during the last glacial maximum lowered sea level by 120 m. The d
18 O difference between the ocean and the
ice is 40%, causing a whole ocean d
18 O change of 1.2%. The reverse process occurs during the melting of large ice sheets. If the
Antarctic and Greenland ice were to melt, then sea level would rise B70 m. The volume of water stored in these ice sheets is
equivalent to B2% of the water in the ocean. Therefore, the mean d
18 O value of the ocean would decrease by 0.7–0.8% (relative to
PDB).
CENOZOIC CLIMATE – OXYGEN ISOTOPE EVIDENCE 415