

atmospheric transport and deposition in general
dominates all other sources for these chemicals in sea
water in open ocean regions.
Table 9 compares the atmospheric and riverine
inputs to the world ocean for a number of synthetic
organochlorine compounds. Note that the atmosphere in most cases accounts for 90% or more of the
input of these compounds to the ocean. Table 9 also
presents estimates of the input of these same organochlorine compounds to the major ocean basins.
Since most of these synthetic organic compounds are
produced and used in the northern hemisphere, it is
not surprising that the flux into the northern hemisphere ocean is greater than that to southern hemisphere marine regions. There are some differences
for specific compounds in different ocean basins. For
example, HCH (hexachlorocyclohexane) and DDT
have a higher input rate to the North Pacific than the
North Atlantic, largely because of the greater use of
these compounds in Asia than in North America or
Europe. On the other hand, the input of PCBs
(polychlorinated biphenyls) and dieldrin is higher to
the North Atlantic than the North Pacific, primarily
because of their greater use in the continental regions
adjacent to the North Atlantic.
Conclusions
The atmosphere transports materials to the ocean
that are both harmful to marine life and that are
essential for marine biological productivity. It is now
apparent that atmospheric transport and deposition
of some metals, nitrogen species, and synthetic organic compounds can be a significant and in some
cases dominant pathway for these substances entering both estuarine and coastal waters as well as some
open ocean regions. Atmospheric input clearly must
be considered in any evaluation of material fluxes to
marine ecosystems. However, the uncertainties in the
1 1.5 2 3 4
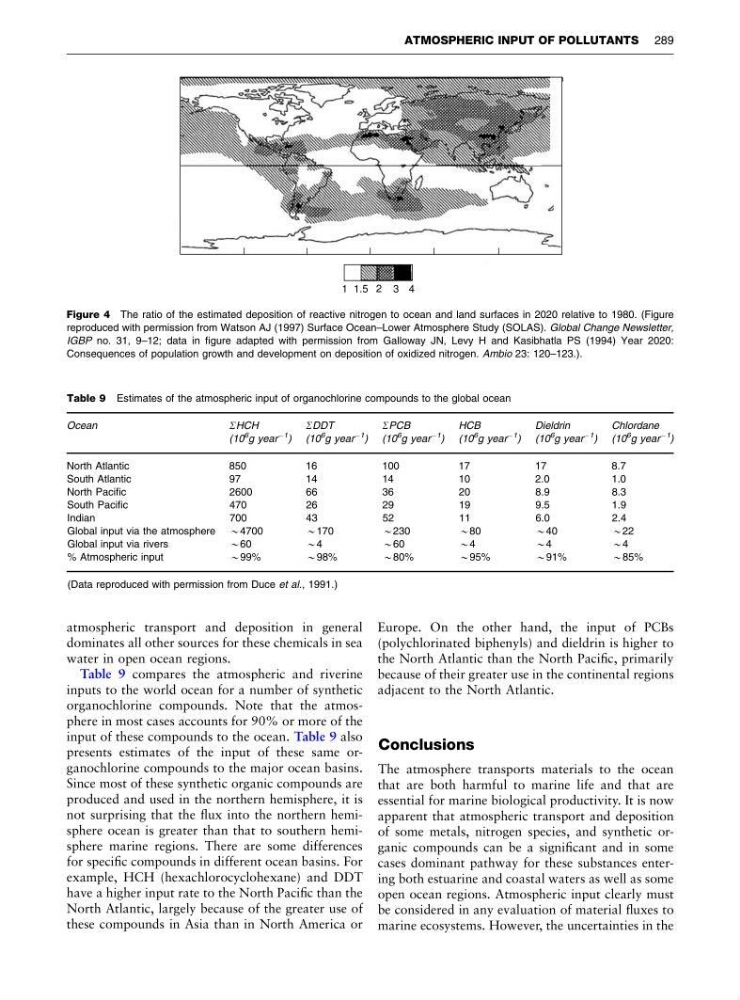
Figure 4 The ratio of the estimated deposition of reactive nitrogen to ocean and land surfaces in 2020 relative to 1980. (Figure
reproduced with permission from Watson AJ (1997) Surface Ocean–Lower Atmosphere Study (SOLAS). Global Change Newsletter,
IGBP no. 31, 9–12; data in figure adapted with permission from Galloway JN, Levy H and Kasibhatla PS (1994) Year 2020:
Consequences of population growth and development on deposition of oxidized nitrogen. Ambio 23: 120–123.).
Table 9 Estimates of the atmospheric input of organochlorine compounds to the global ocean
Ocean
SHCH
(10
6 g year
À1 )
SDDT
(10
6 g year
À1 )
SPCB
(10
6 g year
À1
)
HCB
(10
6 g year
À1 )
Dieldrin
(10
6
g year
À1 )
Chlordane
(10
6 g year
À1
)
North Atlantic
850
16
100
17
17
8.7
South Atlantic
97
14
14
10
2.0
1.0
North Pacific
2600
66
36
20
8.9
8.3
South Pacific
470
26
29
19
9.5
1.9
Indian
700
43
52
11
6.0
2.4
Global input via the atmosphere B4700
B170
B230
B80
B40
B22
Global input via rivers
B60
B4
B60
B4
B4
B4
% Atmospheric input
B99%
B98%
B80%
B95%
B91%
B85%
(Data reproduced with permission from Duce et al., 1991.)
ATMOSPHERIC INPUT OF POLLUTANTS 289
dominates all other sources for these chemicals in sea
water in open ocean regions.
Table 9 compares the atmospheric and riverine
inputs to the world ocean for a number of synthetic
organochlorine compounds. Note that the atmosphere in most cases accounts for 90% or more of the
input of these compounds to the ocean. Table 9 also
presents estimates of the input of these same organochlorine compounds to the major ocean basins.
Since most of these synthetic organic compounds are
produced and used in the northern hemisphere, it is
not surprising that the flux into the northern hemisphere ocean is greater than that to southern hemisphere marine regions. There are some differences
for specific compounds in different ocean basins. For
example, HCH (hexachlorocyclohexane) and DDT
have a higher input rate to the North Pacific than the
North Atlantic, largely because of the greater use of
these compounds in Asia than in North America or
Europe. On the other hand, the input of PCBs
(polychlorinated biphenyls) and dieldrin is higher to
the North Atlantic than the North Pacific, primarily
because of their greater use in the continental regions
adjacent to the North Atlantic.
Conclusions
The atmosphere transports materials to the ocean
that are both harmful to marine life and that are
essential for marine biological productivity. It is now
apparent that atmospheric transport and deposition
of some metals, nitrogen species, and synthetic organic compounds can be a significant and in some
cases dominant pathway for these substances entering both estuarine and coastal waters as well as some
open ocean regions. Atmospheric input clearly must
be considered in any evaluation of material fluxes to
marine ecosystems. However, the uncertainties in the
1 1.5 2 3 4
Figure 4 The ratio of the estimated deposition of reactive nitrogen to ocean and land surfaces in 2020 relative to 1980. (Figure
reproduced with permission from Watson AJ (1997) Surface Ocean–Lower Atmosphere Study (SOLAS). Global Change Newsletter,
IGBP no. 31, 9–12; data in figure adapted with permission from Galloway JN, Levy H and Kasibhatla PS (1994) Year 2020:
Consequences of population growth and development on deposition of oxidized nitrogen. Ambio 23: 120–123.).
Table 9 Estimates of the atmospheric input of organochlorine compounds to the global ocean
Ocean
SHCH
(10
6 g year
À1 )
SDDT
(10
6 g year
À1 )
SPCB
(10
6 g year
À1
)
HCB
(10
6 g year
À1 )
Dieldrin
(10
6
g year
À1 )
Chlordane
(10
6 g year
À1
)
North Atlantic
850
16
100
17
17
8.7
South Atlantic
97
14
14
10
2.0
1.0
North Pacific
2600
66
36
20
8.9
8.3
South Pacific
470
26
29
19
9.5
1.9
Indian
700
43
52
11
6.0
2.4
Global input via the atmosphere B4700
B170
B230
B80
B40
B22
Global input via rivers
B60
B4
B60
B4
B4
B4
% Atmospheric input
B99%
B98%
B80%
B95%
B91%
B85%
(Data reproduced with permission from Duce et al., 1991.)
ATMOSPHERIC INPUT OF POLLUTANTS 289