

the future as a result of increasing human activities.
The amount of nitrogen fixation (formation of reactive nitrogen) produced from energy sources (primarily as NO x , nitrogen oxides), fertilizers, and
legumes in 1990 and in 2020 as a result of human
activities as well as the current and predicted future
geographic distribution of the atmospheric deposition of reactive nitrogen to the continents and
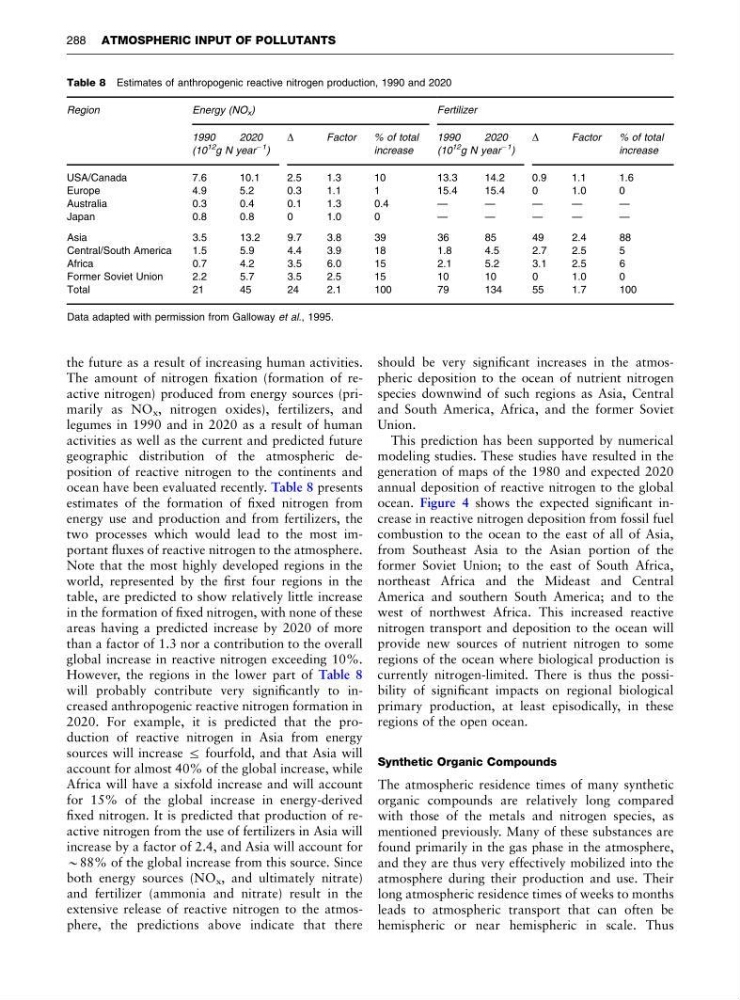
ocean have been evaluated recently. Table 8 presents
estimates of the formation of fixed nitrogen from
energy use and production and from fertilizers, the
two processes which would lead to the most important fluxes of reactive nitrogen to the atmosphere.
Note that the most highly developed regions in the
world, represented by the first four regions in the
table, are predicted to show relatively little increase
in the formation of fixed nitrogen, with none of these
areas having a predicted increase by 2020 of more
than a factor of 1.3 nor a contribution to the overall
global increase in reactive nitrogen exceeding 10%.
However, the regions in the lower part of Table 8
will probably contribute very significantly to increased anthropogenic reactive nitrogen formation in
2020. For example, it is predicted that the production of reactive nitrogen in Asia from energy
sources will increase r fourfold, and that Asia will
account for almost 40% of the global increase, while
Africa will have a sixfold increase and will account
for 15% of the global increase in energy-derived
fixed nitrogen. It is predicted that production of reactive nitrogen from the use of fertilizers in Asia will
increase by a factor of 2.4, and Asia will account for
B88% of the global increase from this source. Since
both energy sources (NO x , and ultimately nitrate)
and fertilizer (ammonia and nitrate) result in the
extensive release of reactive nitrogen to the atmosphere, the predictions above indicate that there
should be very significant increases in the atmospheric deposition to the ocean of nutrient nitrogen
species downwind of such regions as Asia, Central
and South America, Africa, and the former Soviet
Union.
This prediction has been supported by numerical
modeling studies. These studies have resulted in the
generation of maps of the 1980 and expected 2020
annual deposition of reactive nitrogen to the global
ocean. Figure 4 shows the expected significant increase in reactive nitrogen deposition from fossil fuel
combustion to the ocean to the east of all of Asia,
from Southeast Asia to the Asian portion of the
former Soviet Union; to the east of South Africa,
northeast Africa and the Mideast and Central
America and southern South America; and to the
west of northwest Africa. This increased reactive
nitrogen transport and deposition to the ocean will
provide new sources of nutrient nitrogen to some
regions of the ocean where biological production is
currently nitrogen-limited. There is thus the possibility of significant impacts on regional biological
primary production, at least episodically, in these
regions of the open ocean.
Synthetic Organic Compounds
The atmospheric residence times of many synthetic
organic compounds are relatively long compared
with those of the metals and nitrogen species, as
mentioned previously. Many of these substances are
found primarily in the gas phase in the atmosphere,
and they are thus very effectively mobilized into the
atmosphere during their production and use. Their
long atmospheric residence times of weeks to months
leads to atmospheric transport that can often be
hemispheric or near hemispheric in scale. Thus
Table 8 Estimates of anthropogenic reactive nitrogen production, 1990 and 2020
Region
Energy (NO x )
Fertilizer
1990
2020
D
Factor
% of total
increase
1990
2020
D
Factor
% of total
increase
(10
12
g N year
À1 )
(10
12
g N year
À1 )
USA/Canada
7.6
10.1
2.5
1.3
10
13.3
14.2
0.9
1.1
1.6
Europe
4.9
5.2
0.3
1.1
1
15.4
15.4
0
1.0
0
Australia
0.3
0.4
0.1
1.3
0.4
—
—
—
—
—
Japan
0.8
0.8
0
1.0
0
—
—
—
—
—
Asia
3.5
13.2
9.7
3.8
39
36
85
49
2.4
88
Central/South America
1.5
5.9
4.4
3.9
18
1.8
4.5
2.7
2.5
5
Africa
0.7
4.2
3.5
6.0
15
2.1
5.2
3.1
2.5
6
Former Soviet Union
2.2
5.7
3.5
2.5
15
10
10
0
1.0
0
Total
21
45
24
2.1
100
79
134
55
1.7
100
Data adapted with permission from Galloway et al., 1995.
288 ATMOSPHERIC INPUT OF POLLUTANTS
The amount of nitrogen fixation (formation of reactive nitrogen) produced from energy sources (primarily as NO x , nitrogen oxides), fertilizers, and
legumes in 1990 and in 2020 as a result of human
activities as well as the current and predicted future
geographic distribution of the atmospheric deposition of reactive nitrogen to the continents and
ocean have been evaluated recently. Table 8 presents
estimates of the formation of fixed nitrogen from
energy use and production and from fertilizers, the
two processes which would lead to the most important fluxes of reactive nitrogen to the atmosphere.
Note that the most highly developed regions in the
world, represented by the first four regions in the
table, are predicted to show relatively little increase
in the formation of fixed nitrogen, with none of these
areas having a predicted increase by 2020 of more
than a factor of 1.3 nor a contribution to the overall
global increase in reactive nitrogen exceeding 10%.
However, the regions in the lower part of Table 8
will probably contribute very significantly to increased anthropogenic reactive nitrogen formation in
2020. For example, it is predicted that the production of reactive nitrogen in Asia from energy
sources will increase r fourfold, and that Asia will
account for almost 40% of the global increase, while
Africa will have a sixfold increase and will account
for 15% of the global increase in energy-derived
fixed nitrogen. It is predicted that production of reactive nitrogen from the use of fertilizers in Asia will
increase by a factor of 2.4, and Asia will account for
B88% of the global increase from this source. Since
both energy sources (NO x , and ultimately nitrate)
and fertilizer (ammonia and nitrate) result in the
extensive release of reactive nitrogen to the atmosphere, the predictions above indicate that there
should be very significant increases in the atmospheric deposition to the ocean of nutrient nitrogen
species downwind of such regions as Asia, Central
and South America, Africa, and the former Soviet
Union.
This prediction has been supported by numerical
modeling studies. These studies have resulted in the
generation of maps of the 1980 and expected 2020
annual deposition of reactive nitrogen to the global
ocean. Figure 4 shows the expected significant increase in reactive nitrogen deposition from fossil fuel
combustion to the ocean to the east of all of Asia,
from Southeast Asia to the Asian portion of the
former Soviet Union; to the east of South Africa,
northeast Africa and the Mideast and Central
America and southern South America; and to the
west of northwest Africa. This increased reactive
nitrogen transport and deposition to the ocean will
provide new sources of nutrient nitrogen to some
regions of the ocean where biological production is
currently nitrogen-limited. There is thus the possibility of significant impacts on regional biological
primary production, at least episodically, in these
regions of the open ocean.
Synthetic Organic Compounds
The atmospheric residence times of many synthetic
organic compounds are relatively long compared
with those of the metals and nitrogen species, as
mentioned previously. Many of these substances are
found primarily in the gas phase in the atmosphere,
and they are thus very effectively mobilized into the
atmosphere during their production and use. Their
long atmospheric residence times of weeks to months
leads to atmospheric transport that can often be
hemispheric or near hemispheric in scale. Thus
Table 8 Estimates of anthropogenic reactive nitrogen production, 1990 and 2020
Region
Energy (NO x )
Fertilizer
1990
2020
D
Factor
% of total
increase
1990
2020
D
Factor
% of total
increase
(10
12
g N year
À1 )
(10
12
g N year
À1 )
USA/Canada
7.6
10.1
2.5
1.3
10
13.3
14.2
0.9
1.1
1.6
Europe
4.9
5.2
0.3
1.1
1
15.4
15.4
0
1.0
0
Australia
0.3
0.4
0.1
1.3
0.4
—
—
—
—
—
Japan
0.8
0.8
0
1.0
0
—
—
—
—
—
Asia
3.5
13.2
9.7
3.8
39
36
85
49
2.4
88
Central/South America
1.5
5.9
4.4
3.9
18
1.8
4.5
2.7
2.5
5
Africa
0.7
4.2
3.5
6.0
15
2.1
5.2
3.1
2.5
6
Former Soviet Union
2.2
5.7
3.5
2.5
15
10
10
0
1.0
0
Total
21
45
24
2.1
100
79
134
55
1.7
100
Data adapted with permission from Galloway et al., 1995.
288 ATMOSPHERIC INPUT OF POLLUTANTS