

0
4
6
8
1 0
Zinc (nmol kg
−1 )
0
50
100
150
200
Silicic acid (μmol kg −1 )
0
2
3
4
Phosphate (μmol kg −1 )
0
1000
2000
3000
4000
0
1000
2000
3000
4000
0
1000
2000
3000
4000
0
1000
2000
3000
4000
0
1000
2000
3000
4000
0
1000
2000
3000
4000
0
0
1000
2000
3000
4000
0
1000
2000
3000
4000
0
10
20
30
40
50
Nitrate (μmol kg
−1 )
Depth (m)
Depth (m)
0.0 0.2 0.4 0.6 0.8 1.0 1.2
Cadmium (nmol kg
−1 )
Nickel (nmol kg
−1 )
Copper (nmol kg
−1 )
0.0 0.5 1.0 1.5 2.0 2.5 3.0
Manganese (nmol kg
−1 )
Atlantic
Paci fic
(a)
(e)
(f)
(g)
(h)
(b)
(c)
(d)
1
0
2
3
4
5
1
2
4
6
8 10 12
2
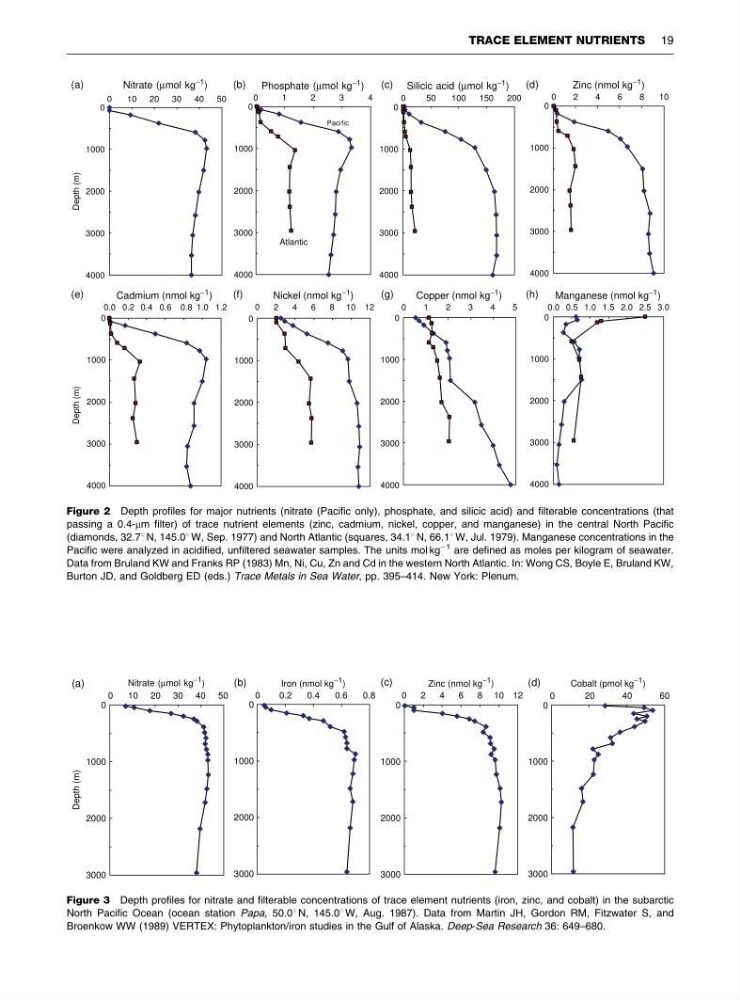
Figure 2 Depth profiles for major nutrients (nitrate (Pacific only), phosphate, and silicic acid) and filterable concentrations (that
passing a 0.4-mm filter) of trace nutrient elements (zinc, cadmium, nickel, copper, and manganese) in the central North Pacific
(diamonds, 32.71 N, 145.01 W, Sep. 1977) and North Atlantic (squares, 34.11 N, 66.11 W, Jul. 1979). Manganese concentrations in the
Pacific were analyzed in acidified, unfiltered seawater samples. The units mol kg
À1 are defined as moles per kilogram of seawater.
Data from Bruland KW and Franks RP (1983) Mn, Ni, Cu, Zn and Cd in the western North Atlantic. In: Wong CS, Boyle E, Bruland KW,
Burton JD, and Goldberg ED (eds.) Trace Metals in Sea Water, pp. 395–414. New York: Plenum.
0
1000
2000
3000
0
1000
2000
3000
0
10 20 30 40 50
Nitrate (μmol kg −1 )
Depth (m)
0
0.2
0.4
0.6
0.8
Iron (nmol kg
−1 )
0
1000
2000
3000
0
1000
2000
3000
0
4
6
8 10 12
Zinc (nmol kg
−1
)
0
2 0
4 0
6 0
Cobalt (pmol kg −1 )
(a)
(b)
(c)
(d)
2
Figure 3 Depth profiles for nitrate and filterable concentrations of trace element nutrients (iron, zinc, and cobalt) in the subarctic
North Pacific Ocean (ocean station Papa, 50.01 N, 145.01 W, Aug. 1987). Data from Martin JH, Gordon RM, Fitzwater S, and
Broenkow WW (1989) VERTEX: Phytoplankton/iron studies in the Gulf of Alaska. Deep-Sea Research 36: 649–680.
TRACE ELEMENT NUTRIENTS 19
4
6
8
1 0
Zinc (nmol kg
−1 )
0
50
100
150
200
Silicic acid (μmol kg −1 )
0
2
3
4
Phosphate (μmol kg −1 )
0
1000
2000
3000
4000
0
1000
2000
3000
4000
0
1000
2000
3000
4000
0
1000
2000
3000
4000
0
1000
2000
3000
4000
0
1000
2000
3000
4000
0
0
1000
2000
3000
4000
0
1000
2000
3000
4000
0
10
20
30
40
50
Nitrate (μmol kg
−1 )
Depth (m)
Depth (m)
0.0 0.2 0.4 0.6 0.8 1.0 1.2
Cadmium (nmol kg
−1 )
Nickel (nmol kg
−1 )
Copper (nmol kg
−1 )
0.0 0.5 1.0 1.5 2.0 2.5 3.0
Manganese (nmol kg
−1 )
Atlantic
Paci fic
(a)
(e)
(f)
(g)
(h)
(b)
(c)
(d)
1
0
2
3
4
5
1
2
4
6
8 10 12
2
Figure 2 Depth profiles for major nutrients (nitrate (Pacific only), phosphate, and silicic acid) and filterable concentrations (that
passing a 0.4-mm filter) of trace nutrient elements (zinc, cadmium, nickel, copper, and manganese) in the central North Pacific
(diamonds, 32.71 N, 145.01 W, Sep. 1977) and North Atlantic (squares, 34.11 N, 66.11 W, Jul. 1979). Manganese concentrations in the
Pacific were analyzed in acidified, unfiltered seawater samples. The units mol kg
À1 are defined as moles per kilogram of seawater.
Data from Bruland KW and Franks RP (1983) Mn, Ni, Cu, Zn and Cd in the western North Atlantic. In: Wong CS, Boyle E, Bruland KW,
Burton JD, and Goldberg ED (eds.) Trace Metals in Sea Water, pp. 395–414. New York: Plenum.
0
1000
2000
3000
0
1000
2000
3000
0
10 20 30 40 50
Nitrate (μmol kg −1 )
Depth (m)
0
0.2
0.4
0.6
0.8
Iron (nmol kg
−1 )
0
1000
2000
3000
0
1000
2000
3000
0
4
6
8 10 12
Zinc (nmol kg
−1
)
0
2 0
4 0
6 0
Cobalt (pmol kg −1 )
(a)
(b)
(c)
(d)
2
Figure 3 Depth profiles for nitrate and filterable concentrations of trace element nutrients (iron, zinc, and cobalt) in the subarctic
North Pacific Ocean (ocean station Papa, 50.01 N, 145.01 W, Aug. 1987). Data from Martin JH, Gordon RM, Fitzwater S, and
Broenkow WW (1989) VERTEX: Phytoplankton/iron studies in the Gulf of Alaska. Deep-Sea Research 36: 649–680.
TRACE ELEMENT NUTRIENTS 19