

metals in the ocean, although again a significant
fraction of this material may not get past the coastal
zone. For the dissolved phase atmospheric and
riverine inputs are roughly equal for metals such as
iron, copper, and nickel; while for zinc, cadmium,
and particularly lead atmospheric inputs appear to
dominate. These estimates were made based on data
collected in the mid-1980s. Extensive efforts to
control the release of atmospheric lead, which has
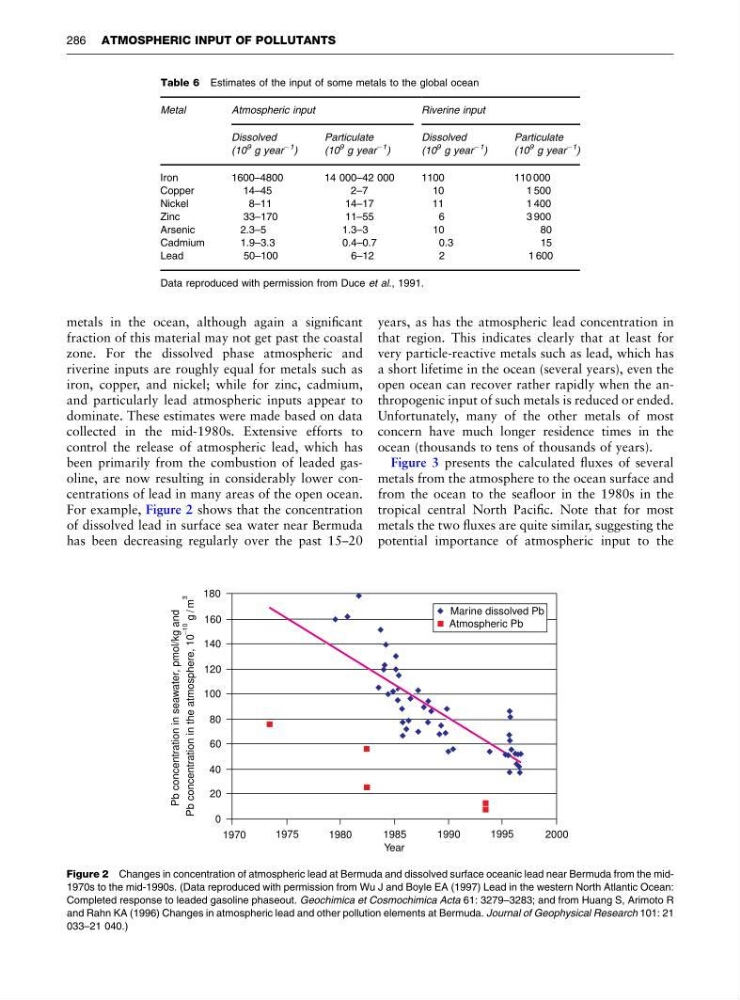
been primarily from the combustion of leaded gasoline, are now resulting in considerably lower concentrations of lead in many areas of the open ocean.
For example, Figure 2 shows that the concentration
of dissolved lead in surface sea water near Bermuda
has been decreasing regularly over the past 15–20
years, as has the atmospheric lead concentration in
that region. This indicates clearly that at least for
very particle-reactive metals such as lead, which has
a short lifetime in the ocean (several years), even the
open ocean can recover rather rapidly when the anthropogenic input of such metals is reduced or ended.
Unfortunately, many of the other metals of most
concern have much longer residence times in the
ocean (thousands to tens of thousands of years).
Figure 3 presents the calculated fluxes of several
metals from the atmosphere to the ocean surface and
from the ocean to the seafloor in the 1980s in the
tropical central North Pacific. Note that for most
metals the two fluxes are quite similar, suggesting the
potential importance of atmospheric input to the
Table 6 Estimates of the input of some metals to the global ocean
Metal
Atmospheric input
Riverine input
Dissolved
(10
9 g year
À1 )
Particulate
(10
9 g year
À1 )
Dissolved
(10
9 g year
À1
)
Particulate
(10
9 g year
À1 )
Iron
1600–4800
14 000–42 000
1100
110 000
Copper
14–45
2–7
10
1 500
Nickel
8–11
14–17
11
1 400
Zinc
33–170
11–55
6
3 900
Arsenic
2.3–5
1.3–3
10
80
Cadmium
1.9–3.3
0.4–0.7
0.3
15
Lead
50–100
6–12
2
1 600
Data reproduced with permission from Duce et al., 1991.
180
160
140
120
100
80
60
40
20
0
1970
1975
1980
1985
1990
1995
2000
Year
Pb concentration in seawater, pmol/kg and
Pb concentration in the atmosphere, 10 g /
m
_ 10
3
Marine dissolved Pb
Atmospheric Pb
Figure 2 Changes in concentration of atmospheric lead at Bermuda and dissolved surface oceanic lead near Bermuda from the mid1970s to the mid-1990s. (Data reproduced with permission from Wu J and Boyle EA (1997) Lead in the western North Atlantic Ocean:
Completed response to leaded gasoline phaseout. Geochimica et Cosmochimica Acta 61: 3279–3283; and from Huang S, Arimoto R
and Rahn KA (1996) Changes in atmospheric lead and other pollution elements at Bermuda. Journal of Geophysical Research 101: 21
033–21 040.)
286 ATMOSPHERIC INPUT OF POLLUTANTS
fraction of this material may not get past the coastal
zone. For the dissolved phase atmospheric and
riverine inputs are roughly equal for metals such as
iron, copper, and nickel; while for zinc, cadmium,
and particularly lead atmospheric inputs appear to
dominate. These estimates were made based on data
collected in the mid-1980s. Extensive efforts to
control the release of atmospheric lead, which has
been primarily from the combustion of leaded gasoline, are now resulting in considerably lower concentrations of lead in many areas of the open ocean.
For example, Figure 2 shows that the concentration
of dissolved lead in surface sea water near Bermuda
has been decreasing regularly over the past 15–20
years, as has the atmospheric lead concentration in
that region. This indicates clearly that at least for
very particle-reactive metals such as lead, which has
a short lifetime in the ocean (several years), even the
open ocean can recover rather rapidly when the anthropogenic input of such metals is reduced or ended.
Unfortunately, many of the other metals of most
concern have much longer residence times in the
ocean (thousands to tens of thousands of years).
Figure 3 presents the calculated fluxes of several
metals from the atmosphere to the ocean surface and
from the ocean to the seafloor in the 1980s in the
tropical central North Pacific. Note that for most
metals the two fluxes are quite similar, suggesting the
potential importance of atmospheric input to the
Table 6 Estimates of the input of some metals to the global ocean
Metal
Atmospheric input
Riverine input
Dissolved
(10
9 g year
À1 )
Particulate
(10
9 g year
À1 )
Dissolved
(10
9 g year
À1
)
Particulate
(10
9 g year
À1 )
Iron
1600–4800
14 000–42 000
1100
110 000
Copper
14–45
2–7
10
1 500
Nickel
8–11
14–17
11
1 400
Zinc
33–170
11–55
6
3 900
Arsenic
2.3–5
1.3–3
10
80
Cadmium
1.9–3.3
0.4–0.7
0.3
15
Lead
50–100
6–12
2
1 600
Data reproduced with permission from Duce et al., 1991.
180
160
140
120
100
80
60
40
20
0
1970
1975
1980
1985
1990
1995
2000
Year
Pb concentration in seawater, pmol/kg and
Pb concentration in the atmosphere, 10 g /
m
_ 10
3
Marine dissolved Pb
Atmospheric Pb
Figure 2 Changes in concentration of atmospheric lead at Bermuda and dissolved surface oceanic lead near Bermuda from the mid1970s to the mid-1990s. (Data reproduced with permission from Wu J and Boyle EA (1997) Lead in the western North Atlantic Ocean:
Completed response to leaded gasoline phaseout. Geochimica et Cosmochimica Acta 61: 3279–3283; and from Huang S, Arimoto R
and Rahn KA (1996) Changes in atmospheric lead and other pollution elements at Bermuda. Journal of Geophysical Research 101: 21
033–21 040.)
286 ATMOSPHERIC INPUT OF POLLUTANTS