

coastal ocean is complicated by the fact that many of
them are found primarily in the gas phase in the atmosphere, and most of the deposition is related to
the wet and dry removal of that phase. The atmospheric residence times of most of these compounds
are long compared with those of metals and nitrogen
species. Thus the potential source regions for these
compounds entering coastal waters can be distant
and widely dispersed.
Figure 1 shows the input of the pesticide lindane to
the North Sea. Note that the atmospheric input of
lindane dominates that from all other sources.
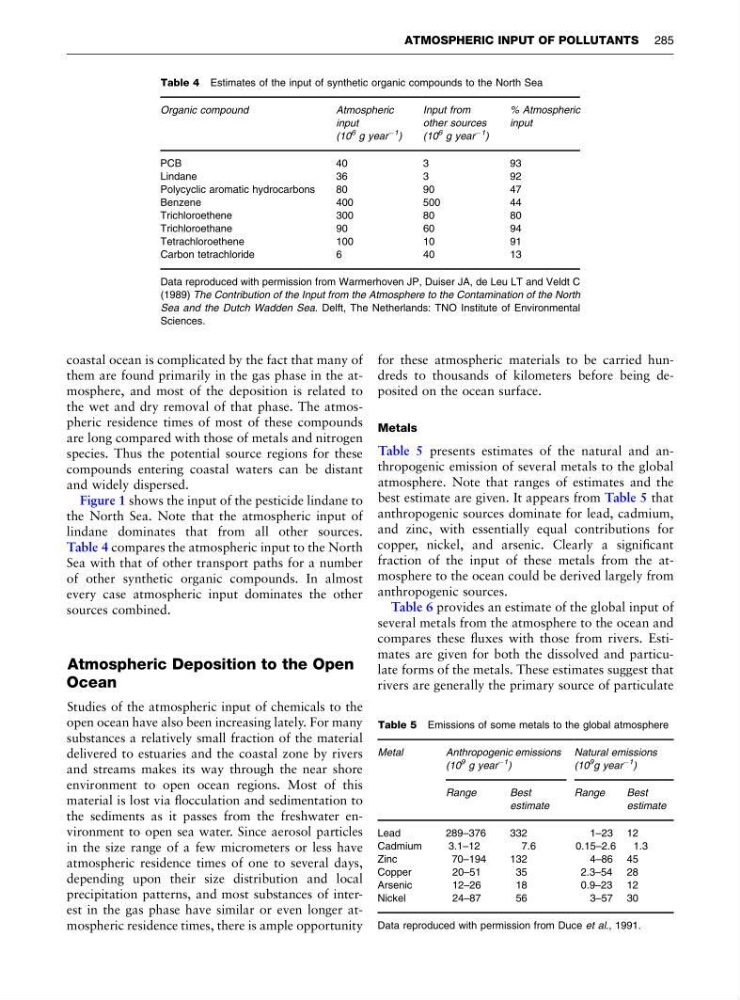
Table 4 compares the atmospheric input to the North
Sea with that of other transport paths for a number
of other synthetic organic compounds. In almost
every case atmospheric input dominates the other
sources combined.
Atmospheric Deposition to the Open
Ocean
Studies of the atmospheric input of chemicals to the
open ocean have also been increasing lately. For many
substances a relatively small fraction of the material
delivered to estuaries and the coastal zone by rivers
and streams makes its way through the near shore
environment to open ocean regions. Most of this
material is lost via flocculation and sedimentation to
the sediments as it passes from the freshwater environment to open sea water. Since aerosol particles
in the size range of a few micrometers or less have
atmospheric residence times of one to several days,
depending upon their size distribution and local
precipitation patterns, and most substances of interest in the gas phase have similar or even longer atmospheric residence times, there is ample opportunity
for these atmospheric materials to be carried hundreds to thousands of kilometers before being deposited on the ocean surface.
Metals
Table 5 presents estimates of the natural and anthropogenic emission of several metals to the global
atmosphere. Note that ranges of estimates and the
best estimate are given. It appears from Table 5 that
anthropogenic sources dominate for lead, cadmium,
and zinc, with essentially equal contributions for
copper, nickel, and arsenic. Clearly a significant
fraction of the input of these metals from the atmosphere to the ocean could be derived largely from
anthropogenic sources.
Table 6 provides an estimate of the global input of
several metals from the atmosphere to the ocean and
compares these fluxes with those from rivers. Estimates are given for both the dissolved and particulate forms of the metals. These estimates suggest that
rivers are generally the primary source of particulate
Table 4 Estimates of the input of synthetic organic compounds to the North Sea
Organic compound
Atmospheric
input
(10
6 g year
À1 )
Input from
other sources
(10
6 g year
À1
)
% Atmospheric
input
PCB
40
3
93
Lindane
36
3
92
Polycyclic aromatic hydrocarbons
80
90
47
Benzene
400
500
44
Trichloroethene
300
80
80
Trichloroethane
90
60
94
Tetrachloroethene
100
10
91
Carbon tetrachloride
6
40
13
Data reproduced with permission from Warmerhoven JP, Duiser JA, de Leu LT and Veldt C
(1989) The Contribution of the Input from the Atmosphere to the Contamination of the North
Sea and the Dutch Wadden Sea. Delft, The Netherlands: TNO Institute of Environmental
Sciences.
Table 5 Emissions of some metals to the global atmosphere
Metal
Anthropogenic emissions
(10
9 g year
À1 )
Natural emissions
(10
9 g year
À1
)
Range
Best
estimate
Range
Best
estimate
Lead
289–376
332
1–23 12
Cadmium
3.1–12
7.6
0.15–2.6
1.3
Zinc
70–194
132
4–86 45
Copper
20–51
35
2.3–54 28
Arsenic
12–26
18
0.9–23 12
Nickel
24–87
56
3–57 30
Data reproduced with permission from Duce et al., 1991.
ATMOSPHERIC INPUT OF POLLUTANTS 285
them are found primarily in the gas phase in the atmosphere, and most of the deposition is related to
the wet and dry removal of that phase. The atmospheric residence times of most of these compounds
are long compared with those of metals and nitrogen
species. Thus the potential source regions for these
compounds entering coastal waters can be distant
and widely dispersed.
Figure 1 shows the input of the pesticide lindane to
the North Sea. Note that the atmospheric input of
lindane dominates that from all other sources.
Table 4 compares the atmospheric input to the North
Sea with that of other transport paths for a number
of other synthetic organic compounds. In almost
every case atmospheric input dominates the other
sources combined.
Atmospheric Deposition to the Open
Ocean
Studies of the atmospheric input of chemicals to the
open ocean have also been increasing lately. For many
substances a relatively small fraction of the material
delivered to estuaries and the coastal zone by rivers
and streams makes its way through the near shore
environment to open ocean regions. Most of this
material is lost via flocculation and sedimentation to
the sediments as it passes from the freshwater environment to open sea water. Since aerosol particles
in the size range of a few micrometers or less have
atmospheric residence times of one to several days,
depending upon their size distribution and local
precipitation patterns, and most substances of interest in the gas phase have similar or even longer atmospheric residence times, there is ample opportunity
for these atmospheric materials to be carried hundreds to thousands of kilometers before being deposited on the ocean surface.
Metals
Table 5 presents estimates of the natural and anthropogenic emission of several metals to the global
atmosphere. Note that ranges of estimates and the
best estimate are given. It appears from Table 5 that
anthropogenic sources dominate for lead, cadmium,
and zinc, with essentially equal contributions for
copper, nickel, and arsenic. Clearly a significant
fraction of the input of these metals from the atmosphere to the ocean could be derived largely from
anthropogenic sources.
Table 6 provides an estimate of the global input of
several metals from the atmosphere to the ocean and
compares these fluxes with those from rivers. Estimates are given for both the dissolved and particulate forms of the metals. These estimates suggest that
rivers are generally the primary source of particulate
Table 4 Estimates of the input of synthetic organic compounds to the North Sea
Organic compound
Atmospheric
input
(10
6 g year
À1 )
Input from
other sources
(10
6 g year
À1
)
% Atmospheric
input
PCB
40
3
93
Lindane
36
3
92
Polycyclic aromatic hydrocarbons
80
90
47
Benzene
400
500
44
Trichloroethene
300
80
80
Trichloroethane
90
60
94
Tetrachloroethene
100
10
91
Carbon tetrachloride
6
40
13
Data reproduced with permission from Warmerhoven JP, Duiser JA, de Leu LT and Veldt C
(1989) The Contribution of the Input from the Atmosphere to the Contamination of the North
Sea and the Dutch Wadden Sea. Delft, The Netherlands: TNO Institute of Environmental
Sciences.
Table 5 Emissions of some metals to the global atmosphere
Metal
Anthropogenic emissions
(10
9 g year
À1 )
Natural emissions
(10
9 g year
À1
)
Range
Best
estimate
Range
Best
estimate
Lead
289–376
332
1–23 12
Cadmium
3.1–12
7.6
0.15–2.6
1.3
Zinc
70–194
132
4–86 45
Copper
20–51
35
2.3–54 28
Arsenic
12–26
18
0.9–23 12
Nickel
24–87
56
3–57 30
Data reproduced with permission from Duce et al., 1991.
ATMOSPHERIC INPUT OF POLLUTANTS 285