

precipitation falling directly on the Bay or its watershed. These studies were different from most earlier
studies because the atmospheric contributions were
considered not only to be direct deposition on the
water surface, but also to include that coming in via
the atmosphere but falling on the watershed and then
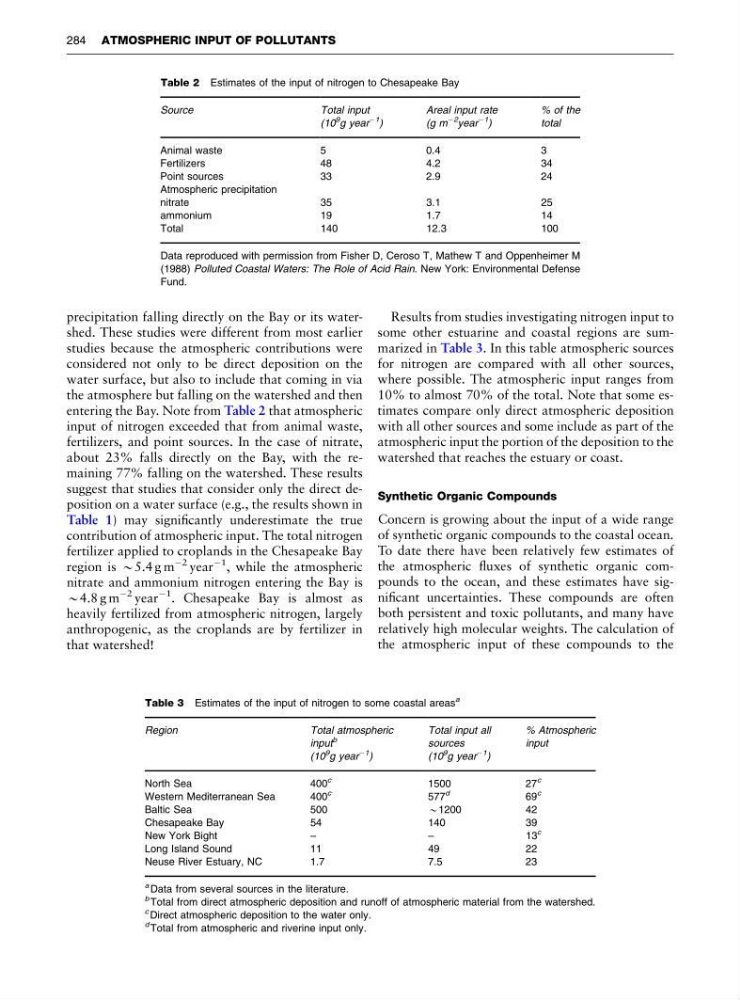
entering the Bay. Note from Table 2 that atmospheric
input of nitrogen exceeded that from animal waste,
fertilizers, and point sources. In the case of nitrate,
about 23% falls directly on the Bay, with the remaining 77% falling on the watershed. These results
suggest that studies that consider only the direct deposition on a water surface (e.g., the results shown in
Table 1) may significantly underestimate the true
contribution of atmospheric input. The total nitrogen
fertilizer applied to croplands in the Chesapeake Bay
region is B5.4 g m
À2 year
À1
, while the atmospheric
nitrate and ammonium nitrogen entering the Bay is
B4.8 g m
À2 year
À1
. Chesapeake Bay is almost as
heavily fertilized from atmospheric nitrogen, largely
anthropogenic, as the croplands are by fertilizer in
that watershed!
Results from studies investigating nitrogen input to
some other estuarine and coastal regions are summarized in Table 3. In this table atmospheric sources
for nitrogen are compared with all other sources,
where possible. The atmospheric input ranges from
10% to almost 70% of the total. Note that some estimates compare only direct atmospheric deposition
with all other sources and some include as part of the
atmospheric input the portion of the deposition to the
watershed that reaches the estuary or coast.
Synthetic Organic Compounds
Concern is growing about the input of a wide range
of synthetic organic compounds to the coastal ocean.
To date there have been relatively few estimates of
the atmospheric fluxes of synthetic organic compounds to the ocean, and these estimates have significant uncertainties. These compounds are often
both persistent and toxic pollutants, and many have
relatively high molecular weights. The calculation of
the atmospheric input of these compounds to the
Table 2 Estimates of the input of nitrogen to Chesapeake Bay
Source
Total input
(10
9 g year
À1
)
Areal input rate
(g m
À2
year
À1
)
% of the
total
Animal waste
5
0.4
3
Fertilizers
48
4.2
34
Point sources
33
2.9
24
Atmospheric precipitation
nitrate
35
3.1
25
ammonium
19
1.7
14
Total
140
12.3
100
Data reproduced with permission from Fisher D, Ceroso T, Mathew T and Oppenheimer M
(1988) Polluted Coastal Waters: The Role of Acid Rain. New York: Environmental Defense
Fund.
Table 3 Estimates of the input of nitrogen to some coastal areas
a
Region
Total atmospheric
input
b
(10
9 g year
À1 )
Total input all
sources
(10
9 g year
À1 )
% Atmospheric
input
North Sea
400
c
1500
27
c
Western Mediterranean Sea
400
c
577
d
69
c
Baltic Sea
500
B1200
42
Chesapeake Bay
54
140
39
New York Bight
–
–
13
c
Long Island Sound
11
49
22
Neuse River Estuary, NC
1.7
7.5
23
a Data from several sources in the literature.
b Total from direct atmospheric deposition and runoff of atmospheric material from the watershed.
c Direct atmospheric deposition to the water only.
d Total from atmospheric and riverine input only.
284 ATMOSPHERIC INPUT OF POLLUTANTS
studies because the atmospheric contributions were
considered not only to be direct deposition on the
water surface, but also to include that coming in via
the atmosphere but falling on the watershed and then
entering the Bay. Note from Table 2 that atmospheric
input of nitrogen exceeded that from animal waste,
fertilizers, and point sources. In the case of nitrate,
about 23% falls directly on the Bay, with the remaining 77% falling on the watershed. These results
suggest that studies that consider only the direct deposition on a water surface (e.g., the results shown in
Table 1) may significantly underestimate the true
contribution of atmospheric input. The total nitrogen
fertilizer applied to croplands in the Chesapeake Bay
region is B5.4 g m
À2 year
À1
, while the atmospheric
nitrate and ammonium nitrogen entering the Bay is
B4.8 g m
À2 year
À1
. Chesapeake Bay is almost as
heavily fertilized from atmospheric nitrogen, largely
anthropogenic, as the croplands are by fertilizer in
that watershed!
Results from studies investigating nitrogen input to
some other estuarine and coastal regions are summarized in Table 3. In this table atmospheric sources
for nitrogen are compared with all other sources,
where possible. The atmospheric input ranges from
10% to almost 70% of the total. Note that some estimates compare only direct atmospheric deposition
with all other sources and some include as part of the
atmospheric input the portion of the deposition to the
watershed that reaches the estuary or coast.
Synthetic Organic Compounds
Concern is growing about the input of a wide range
of synthetic organic compounds to the coastal ocean.
To date there have been relatively few estimates of
the atmospheric fluxes of synthetic organic compounds to the ocean, and these estimates have significant uncertainties. These compounds are often
both persistent and toxic pollutants, and many have
relatively high molecular weights. The calculation of
the atmospheric input of these compounds to the
Table 2 Estimates of the input of nitrogen to Chesapeake Bay
Source
Total input
(10
9 g year
À1
)
Areal input rate
(g m
À2
year
À1
)
% of the
total
Animal waste
5
0.4
3
Fertilizers
48
4.2
34
Point sources
33
2.9
24
Atmospheric precipitation
nitrate
35
3.1
25
ammonium
19
1.7
14
Total
140
12.3
100
Data reproduced with permission from Fisher D, Ceroso T, Mathew T and Oppenheimer M
(1988) Polluted Coastal Waters: The Role of Acid Rain. New York: Environmental Defense
Fund.
Table 3 Estimates of the input of nitrogen to some coastal areas
a
Region
Total atmospheric
input
b
(10
9 g year
À1 )
Total input all
sources
(10
9 g year
À1 )
% Atmospheric
input
North Sea
400
c
1500
27
c
Western Mediterranean Sea
400
c
577
d
69
c
Baltic Sea
500
B1200
42
Chesapeake Bay
54
140
39
New York Bight
–
–
13
c
Long Island Sound
11
49
22
Neuse River Estuary, NC
1.7
7.5
23
a Data from several sources in the literature.
b Total from direct atmospheric deposition and runoff of atmospheric material from the watershed.
c Direct atmospheric deposition to the water only.
d Total from atmospheric and riverine input only.
284 ATMOSPHERIC INPUT OF POLLUTANTS