

sediments, as well as the atmospheric contribution to
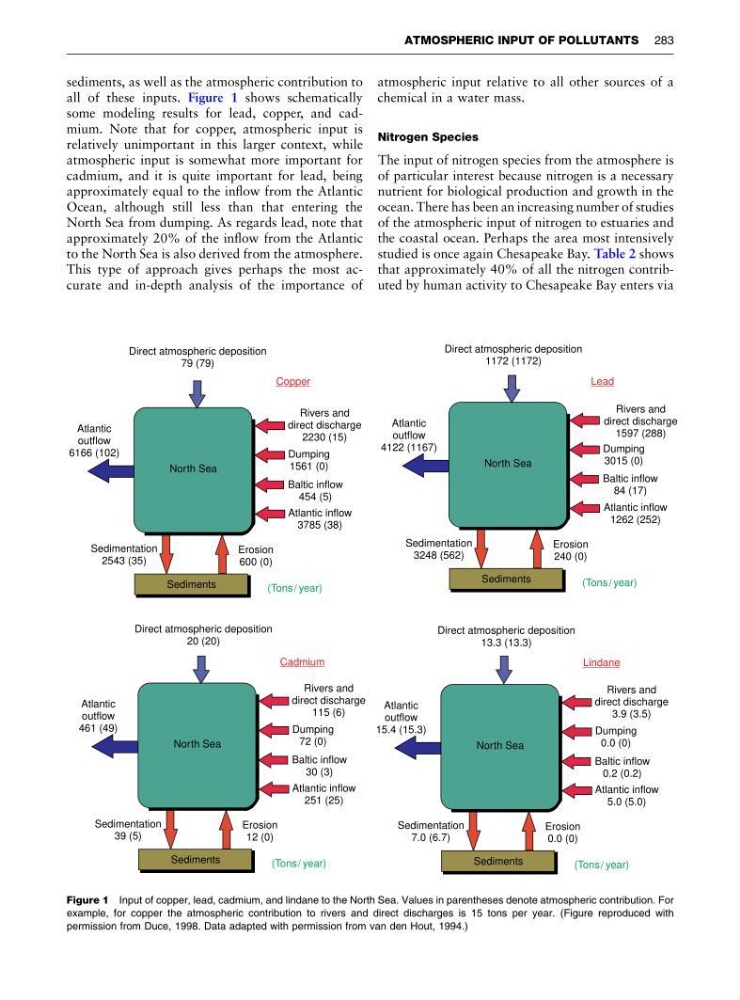
all of these inputs. Figure 1 shows schematically
some modeling results for lead, copper, and cadmium. Note that for copper, atmospheric input is
relatively unimportant in this larger context, while
atmospheric input is somewhat more important for
cadmium, and it is quite important for lead, being
approximately equal to the inflow from the Atlantic
Ocean, although still less than that entering the
North Sea from dumping. As regards lead, note that
approximately 20% of the inflow from the Atlantic
to the North Sea is also derived from the atmosphere.
This type of approach gives perhaps the most accurate and in-depth analysis of the importance of
atmospheric input relative to all other sources of a
chemical in a water mass.
Nitrogen Species
The input of nitrogen species from the atmosphere is
of particular interest because nitrogen is a necessary
nutrient for biological production and growth in the
ocean. There has been an increasing number of studies
of the atmospheric input of nitrogen to estuaries and
the coastal ocean. Perhaps the area most intensively
studied is once again Chesapeake Bay. Table 2 shows
that approximately 40% of all the nitrogen contributed by human activity to Chesapeake Bay enters via
Direct atmospheric deposition
79 (79)
Direct atmospheric deposition
20 (20)
Direct atmospheric deposition
13.3 (13.3)
Direct atmospheric deposition
1172 (1172)
Copper
Cadmium
Lindane
Lead
Rivers and
direct discharge
2230 (15)
Rivers and
direct discharge
115 (6)
Rivers and
direct discharge
3.9 (3.5)
Rivers and
direct discharge
1597 (288)
Dumping
1561 (0)
Dumping
72 (0)
Dumping
0.0 (0)
Dumping
3015 (0)
Baltic inflow
454 (5)
Baltic inflow
30 (3)
Baltic inflow
0.2 (0.2)
Baltic inflow
84 (17)
Atlantic inflow
3785 (38)
Atlantic inflow
251 (25)
Atlantic inflow
5.0 (5.0)
Atlantic inflow
1262 (252)
Erosion
600 (0)
Erosion
12 (0)
Erosion
0.0 (0)
Erosion
240 (0)
Sedimentation
2543 (35)
Sedimentation
39 (5)
Sedimentation
7.0 (6.7)
Sedimentation
3248 (562)
Atlantic
outflow
6166 (102)
Atlantic
outflow
461 (49)
Atlantic
outflow
15.4 (15.3)
Atlantic
outflow
4122 (1167)
North Sea
North Sea
North Sea
North Sea
Sediments
Sediments
Sediments
Sediments
(Tons/ year)
(Tons/ year)
(Tons/ year)
(Tons/ year)
Figure 1 Input of copper, lead, cadmium, and lindane to the North Sea. Values in parentheses denote atmospheric contribution. For
example, for copper the atmospheric contribution to rivers and direct discharges is 15 tons per year. (Figure reproduced with
permission from Duce, 1998. Data adapted with permission from van den Hout, 1994.)
ATMOSPHERIC INPUT OF POLLUTANTS 283
all of these inputs. Figure 1 shows schematically
some modeling results for lead, copper, and cadmium. Note that for copper, atmospheric input is
relatively unimportant in this larger context, while
atmospheric input is somewhat more important for
cadmium, and it is quite important for lead, being
approximately equal to the inflow from the Atlantic
Ocean, although still less than that entering the
North Sea from dumping. As regards lead, note that
approximately 20% of the inflow from the Atlantic
to the North Sea is also derived from the atmosphere.
This type of approach gives perhaps the most accurate and in-depth analysis of the importance of
atmospheric input relative to all other sources of a
chemical in a water mass.
Nitrogen Species
The input of nitrogen species from the atmosphere is
of particular interest because nitrogen is a necessary
nutrient for biological production and growth in the
ocean. There has been an increasing number of studies
of the atmospheric input of nitrogen to estuaries and
the coastal ocean. Perhaps the area most intensively
studied is once again Chesapeake Bay. Table 2 shows
that approximately 40% of all the nitrogen contributed by human activity to Chesapeake Bay enters via
Direct atmospheric deposition
79 (79)
Direct atmospheric deposition
20 (20)
Direct atmospheric deposition
13.3 (13.3)
Direct atmospheric deposition
1172 (1172)
Copper
Cadmium
Lindane
Lead
Rivers and
direct discharge
2230 (15)
Rivers and
direct discharge
115 (6)
Rivers and
direct discharge
3.9 (3.5)
Rivers and
direct discharge
1597 (288)
Dumping
1561 (0)
Dumping
72 (0)
Dumping
0.0 (0)
Dumping
3015 (0)
Baltic inflow
454 (5)
Baltic inflow
30 (3)
Baltic inflow
0.2 (0.2)
Baltic inflow
84 (17)
Atlantic inflow
3785 (38)
Atlantic inflow
251 (25)
Atlantic inflow
5.0 (5.0)
Atlantic inflow
1262 (252)
Erosion
600 (0)
Erosion
12 (0)
Erosion
0.0 (0)
Erosion
240 (0)
Sedimentation
2543 (35)
Sedimentation
39 (5)
Sedimentation
7.0 (6.7)
Sedimentation
3248 (562)
Atlantic
outflow
6166 (102)
Atlantic
outflow
461 (49)
Atlantic
outflow
15.4 (15.3)
Atlantic
outflow
4122 (1167)
North Sea
North Sea
North Sea
North Sea
Sediments
Sediments
Sediments
Sediments
(Tons/ year)
(Tons/ year)
(Tons/ year)
(Tons/ year)
Figure 1 Input of copper, lead, cadmium, and lindane to the North Sea. Values in parentheses denote atmospheric contribution. For
example, for copper the atmospheric contribution to rivers and direct discharges is 15 tons per year. (Figure reproduced with
permission from Duce, 1998. Data adapted with permission from van den Hout, 1994.)
ATMOSPHERIC INPUT OF POLLUTANTS 283