

used in some studies of atmospheric deposition of
particles to the ocean:
• Submicrometer aerosol particles, 0.001 m s
À1
7 a
factor of three
• Supermicrometer crustal particles not associated
with sea salt, 0.01 m s
À1
7 a factor of three
• Giant sea-salt particles and materials carried by
them, 0.03 m s
À1
7 a factor of two
Proper use of eqn [1] requires that information be
available on the size distribution of the aerosol particles and the material present in them.
Particle and Gas Wet Deposition
The direct measurement of contaminants in precipitation samples is certainly the best approach for determining wet deposition, but problems with rain
sampling, contamination, and the natural variability
of the concentration of trace substances in precipitation often make representative flux estimates difficult using this approach. Studies have shown that
the concentration of a substance in rain is related to
the concentration of that substance in the atmosphere. This relationship can be expressed in terms of
a scavenging ratio, S:
S ¼ C r Á r Á C
À1
a=g
½2
where C r is the concentration of the substance in rain
(e.g., in g kg
À1
), r is the density of air (B1.2 kg m
À3
),
C a/g is the aerosol or gas phase concentration in the
atmosphere (e.g., in g m
À3
), and S is dimensionless.
Values of S for substances present in aerosol particles
range from a few hundred to a few thousand, which
roughly means that 1 g (or 1 ml) of rain scavenges
D1 m
3 of air. For aerosols, S is dependent upon such
factors as particle size and chemical composition.
For gases, S can vary over many orders of magnitude
depending on the specific gas, its Henry’s law constant, and its gas/water exchange coefficient. For
both aerosols and gases, S is also dependent upon the
vertical concentration distribution and vertical extent of the precipitating cloud, so the use of scavenging ratios requires great care, and the results have
significant uncertainties. However, if the concentration of an atmospheric substance and its scavenging ratio are known, the scavenging ratio
approach can be used to estimate wet deposition
fluxes as follows:
F r ¼ P Á C r ¼ P Á S Á C a=g Á r
À1
½3
where F r is the wet deposition flux (e.g., in g m
À2 year
À1
)
and P is the precipitation rate (e.g., in m year
À1
), with
appropriate conversion factors to translate rainfall
depth to mass of water per unit area. Note that
P Á S Á r
À1 is equivalent to a wet deposition velocity.
Atmospheric Deposition to Estuaries
and the Coastal Ocean
Metals
The atmospheric deposition of certain metals to
coastal and estuarine regions has been studied more
than that for any other chemicals. These metals are
generally present on particles in the atmosphere.
Chesapeake Bay is among the most thoroughly
studied regions in North America in this regard.
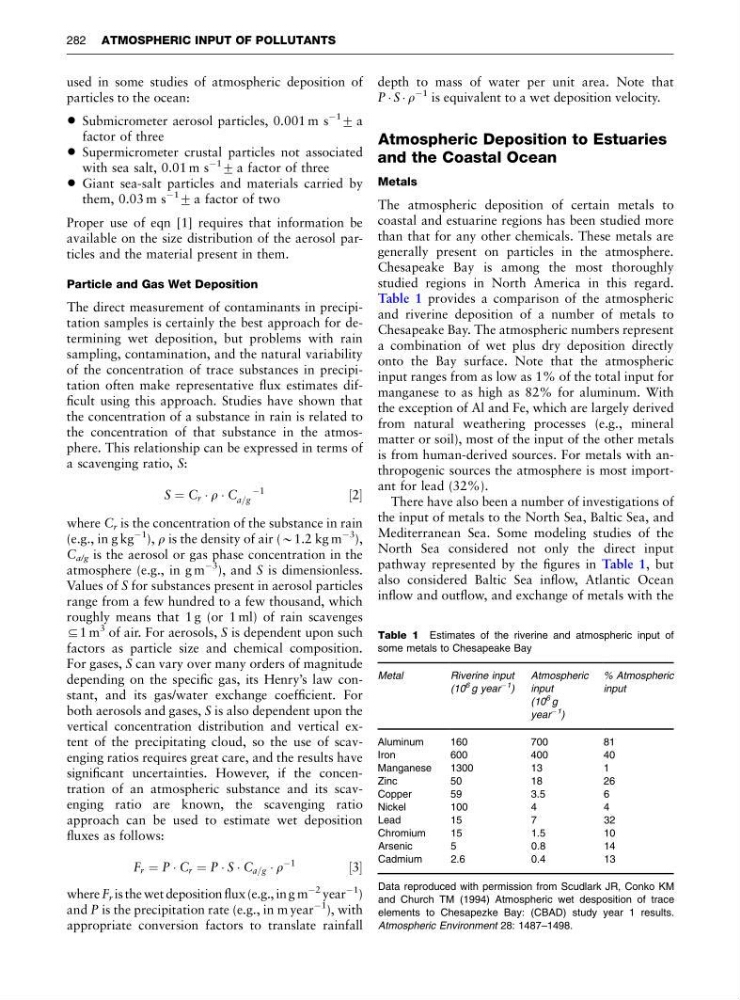
Table 1 provides a comparison of the atmospheric
and riverine deposition of a number of metals to
Chesapeake Bay. The atmospheric numbers represent
a combination of wet plus dry deposition directly
onto the Bay surface. Note that the atmospheric
input ranges from as low as 1% of the total input for
manganese to as high as 82% for aluminum. With
the exception of Al and Fe, which are largely derived
from natural weathering processes (e.g., mineral
matter or soil), most of the input of the other metals
is from human-derived sources. For metals with anthropogenic sources the atmosphere is most important for lead (32%).
There have also been a number of investigations of
the input of metals to the North Sea, Baltic Sea, and
Mediterranean Sea. Some modeling studies of the
North Sea considered not only the direct input
pathway represented by the figures in Table 1, but
also considered Baltic Sea inflow, Atlantic Ocean
inflow and outflow, and exchange of metals with the
Table 1 Estimates of the riverine and atmospheric input of
some metals to Chesapeake Bay
Metal
Riverine input
(10
6 g year
À1 )
Atmospheric
input
(10
6 g
year
À1
)
% Atmospheric
input
Aluminum
160
700
81
Iron
600
400
40
Manganese
1300
13
1
Zinc
50
18
26
Copper
59
3.5
6
Nickel
100
4
4
Lead
15
7
32
Chromium
15
1.5
10
Arsenic
5
0.8
14
Cadmium
2.6
0.4
13
Data reproduced with permission from Scudlark JR, Conko KM
and Church TM (1994) Atmospheric wet desposition of trace
elements to Chesapezke Bay: (CBAD) study year 1 results.
Atmospheric Environment 28: 1487–1498.
282 ATMOSPHERIC INPUT OF POLLUTANTS
particles to the ocean:
• Submicrometer aerosol particles, 0.001 m s
À1
7 a
factor of three
• Supermicrometer crustal particles not associated
with sea salt, 0.01 m s
À1
7 a factor of three
• Giant sea-salt particles and materials carried by
them, 0.03 m s
À1
7 a factor of two
Proper use of eqn [1] requires that information be
available on the size distribution of the aerosol particles and the material present in them.
Particle and Gas Wet Deposition
The direct measurement of contaminants in precipitation samples is certainly the best approach for determining wet deposition, but problems with rain
sampling, contamination, and the natural variability
of the concentration of trace substances in precipitation often make representative flux estimates difficult using this approach. Studies have shown that
the concentration of a substance in rain is related to
the concentration of that substance in the atmosphere. This relationship can be expressed in terms of
a scavenging ratio, S:
S ¼ C r Á r Á C
À1
a=g
½2
where C r is the concentration of the substance in rain
(e.g., in g kg
À1
), r is the density of air (B1.2 kg m
À3
),
C a/g is the aerosol or gas phase concentration in the
atmosphere (e.g., in g m
À3
), and S is dimensionless.
Values of S for substances present in aerosol particles
range from a few hundred to a few thousand, which
roughly means that 1 g (or 1 ml) of rain scavenges
D1 m
3 of air. For aerosols, S is dependent upon such
factors as particle size and chemical composition.
For gases, S can vary over many orders of magnitude
depending on the specific gas, its Henry’s law constant, and its gas/water exchange coefficient. For
both aerosols and gases, S is also dependent upon the
vertical concentration distribution and vertical extent of the precipitating cloud, so the use of scavenging ratios requires great care, and the results have
significant uncertainties. However, if the concentration of an atmospheric substance and its scavenging ratio are known, the scavenging ratio
approach can be used to estimate wet deposition
fluxes as follows:
F r ¼ P Á C r ¼ P Á S Á C a=g Á r
À1
½3
where F r is the wet deposition flux (e.g., in g m
À2 year
À1
)
and P is the precipitation rate (e.g., in m year
À1
), with
appropriate conversion factors to translate rainfall
depth to mass of water per unit area. Note that
P Á S Á r
À1 is equivalent to a wet deposition velocity.
Atmospheric Deposition to Estuaries
and the Coastal Ocean
Metals
The atmospheric deposition of certain metals to
coastal and estuarine regions has been studied more
than that for any other chemicals. These metals are
generally present on particles in the atmosphere.
Chesapeake Bay is among the most thoroughly
studied regions in North America in this regard.
Table 1 provides a comparison of the atmospheric
and riverine deposition of a number of metals to
Chesapeake Bay. The atmospheric numbers represent
a combination of wet plus dry deposition directly
onto the Bay surface. Note that the atmospheric
input ranges from as low as 1% of the total input for
manganese to as high as 82% for aluminum. With
the exception of Al and Fe, which are largely derived
from natural weathering processes (e.g., mineral
matter or soil), most of the input of the other metals
is from human-derived sources. For metals with anthropogenic sources the atmosphere is most important for lead (32%).
There have also been a number of investigations of
the input of metals to the North Sea, Baltic Sea, and
Mediterranean Sea. Some modeling studies of the
North Sea considered not only the direct input
pathway represented by the figures in Table 1, but
also considered Baltic Sea inflow, Atlantic Ocean
inflow and outflow, and exchange of metals with the
Table 1 Estimates of the riverine and atmospheric input of
some metals to Chesapeake Bay
Metal
Riverine input
(10
6 g year
À1 )
Atmospheric
input
(10
6 g
year
À1
)
% Atmospheric
input
Aluminum
160
700
81
Iron
600
400
40
Manganese
1300
13
1
Zinc
50
18
26
Copper
59
3.5
6
Nickel
100
4
4
Lead
15
7
32
Chromium
15
1.5
10
Arsenic
5
0.8
14
Cadmium
2.6
0.4
13
Data reproduced with permission from Scudlark JR, Conko KM
and Church TM (1994) Atmospheric wet desposition of trace
elements to Chesapezke Bay: (CBAD) study year 1 results.
Atmospheric Environment 28: 1487–1498.
282 ATMOSPHERIC INPUT OF POLLUTANTS