

Decreasing concentrations of Pb in surface waters
of the Atlantic Ocean have been documented by
observations from 1979 until the present (Figure 3).
The decreasing concentration of Pb in the upper
layers of the ocean is also observed (Figure 4), with a
slower response in the deeper waters that are replaced on decadal timescales. These decreases are
seen in other parts of the Atlantic and North Pacific
as well. This evidence amply demonstrates that the
phasing out of leaded gasoline in the USA has been
closely followed by decreases of the Pb concentration
of the ocean on the appropriate timescale.
In the period before direct observations of Pb in
the ocean, the response of oceanic Pb to earlier
changes in emissions are documented by the Pb
content of reef-building corals. Corals precipitate
calcium carbonate skeletons with annual variations
in their density that can be counted in the same way
as tree rings, hence providing a chronology of the
time of deposition. In corals from near Bermuda,
concentrations of Pb increased from very low levels
in the 1880s to higher levels in the 1920s, in pace
with the emissions of Pb from high temperature industrial activities (smelting, coal combustion, etc.)
(Figure 5). With the introduction of leaded gasoline,
Pb increased far more until the mid-1970s, when
coralline Pb began to decrease with the phasing out
of leaded gasoline, confirming the picture provided
by direct observations in this period.
Other information on the sources and dispersion
of anthropogenic lead can be derived from the stable
isotope ratios of lead (e.g.
206
Pb/
207 Pb) which vary
from one mining source to another because of differing Pb/U and Pb/Th for geological sources of lead.
In particular, US leaded gasoline for many years had
a
206 Pb/
207 Pb ratio of 41.20, whereas European
0
50
100
150
200
250
300
1930
1940
1950
1960
1970
1980
1990
USA
Germany
France
UK
Italy
Year
Gasoline Pb consumption (10
metric tonnes per year)
3
US and European gasoline Pb consumption, 1930 _ 93
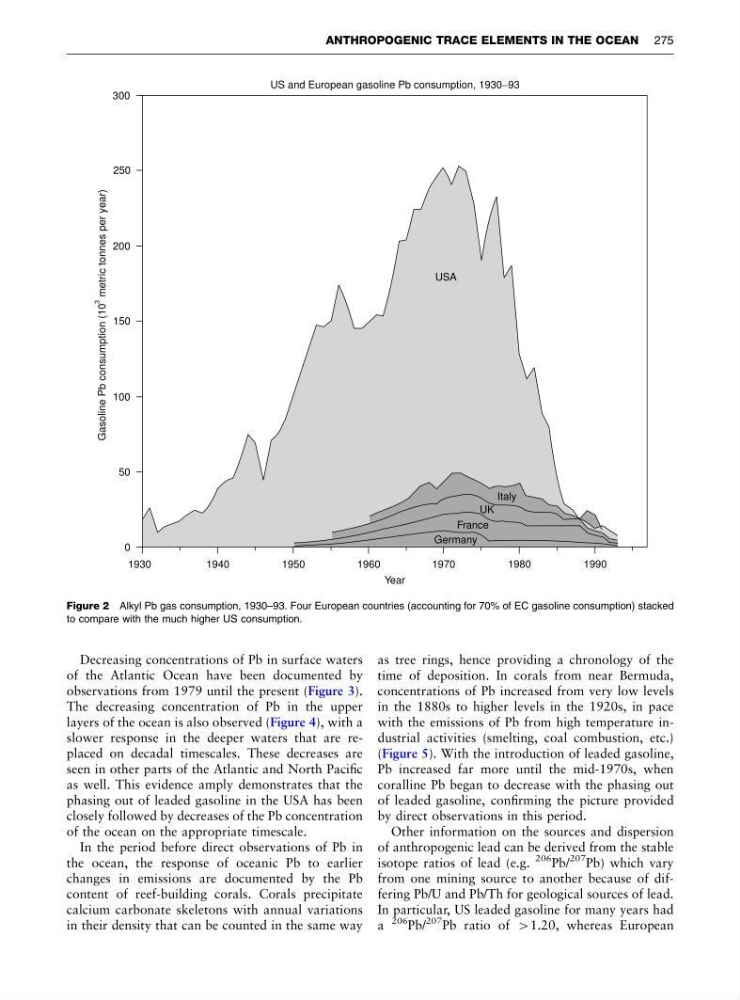
Figure 2 Alkyl Pb gas consumption, 1930–93. Four European countries (accounting for 70% of EC gasoline consumption) stacked
to compare with the much higher US consumption.
ANTHROPOGENIC TRACE ELEMENTS IN THE OCEAN 275
of the Atlantic Ocean have been documented by
observations from 1979 until the present (Figure 3).
The decreasing concentration of Pb in the upper
layers of the ocean is also observed (Figure 4), with a
slower response in the deeper waters that are replaced on decadal timescales. These decreases are
seen in other parts of the Atlantic and North Pacific
as well. This evidence amply demonstrates that the
phasing out of leaded gasoline in the USA has been
closely followed by decreases of the Pb concentration
of the ocean on the appropriate timescale.
In the period before direct observations of Pb in
the ocean, the response of oceanic Pb to earlier
changes in emissions are documented by the Pb
content of reef-building corals. Corals precipitate
calcium carbonate skeletons with annual variations
in their density that can be counted in the same way
as tree rings, hence providing a chronology of the
time of deposition. In corals from near Bermuda,
concentrations of Pb increased from very low levels
in the 1880s to higher levels in the 1920s, in pace
with the emissions of Pb from high temperature industrial activities (smelting, coal combustion, etc.)
(Figure 5). With the introduction of leaded gasoline,
Pb increased far more until the mid-1970s, when
coralline Pb began to decrease with the phasing out
of leaded gasoline, confirming the picture provided
by direct observations in this period.
Other information on the sources and dispersion
of anthropogenic lead can be derived from the stable
isotope ratios of lead (e.g.
206
Pb/
207 Pb) which vary
from one mining source to another because of differing Pb/U and Pb/Th for geological sources of lead.
In particular, US leaded gasoline for many years had
a
206 Pb/
207 Pb ratio of 41.20, whereas European
0
50
100
150
200
250
300
1930
1940
1950
1960
1970
1980
1990
USA
Germany
France
UK
Italy
Year
Gasoline Pb consumption (10
metric tonnes per year)
3
US and European gasoline Pb consumption, 1930 _ 93
Figure 2 Alkyl Pb gas consumption, 1930–93. Four European countries (accounting for 70% of EC gasoline consumption) stacked
to compare with the much higher US consumption.
ANTHROPOGENIC TRACE ELEMENTS IN THE OCEAN 275