

consequence of remineralization of phytoplankton.
In contrast, lead has higher concentrations in the
surface waters of the Atlantic, reflecting an atmospheric input. The strength of the atmospheric lead
source appears to be declining as a result of a decrease in the use of leaded petrol. The monitoring of
dissolved lead in the waters around Bermuda over a
15-year period shows that lead concentrations have
decreased significantly. Since the SPM concentrations
in these waters are low, the changes in dissolved lead
concentrations are controlled almost exclusively by
the flushing time of the water and the changing lead
inputs. Following the decline in the atmospheric
input, these waters have relaxed to near-background
concentrations of dissolved lead (Figure 4).
Environmental Impact
The sediments of coastal regions reflect the long-term
accumulation of metal contamination. Assessments
of the anthropogenic component of metals in sediments require that the grain size must be accounted
for and the corrected metal concentration compared
with an uncontaminated reference material. For
sediments with similar grain sizes, normalization is
achieved with respect to a major element that is
unaffected by anthropogenic inputs, such as aluminum, lithium, or rubidium. The enrichment factor
(EF) is then defined as in eqn [2].
EF ¼
M p
 Ã
= A1 p
Â
Ã
M r
½ = A1 r
½
½2
Here [M p ] and [M r ] are the metal concentrations in
particulate matter and in crustal rock, respectively,
and [Al p ] and [Al r ] are the concentrations of aluminum (or any suitable reference element) in particulate matter and crustal rock, respectively. Table 3
lists EFs for SPM or fine sediment in contrasting
estuaries. Enrichment factors are close to unity for
the baseline sediment and in the ‘pristine’ Lena Estuary, while the greatest EF values are encountered
for cadmium in the Rhine (impacted by the production of phosphate fertilizers) and the Scheldt, and
for copper in Restronguet Creek (impacted by historical mining activity). The general sequence of EFs
250
200
150
100
50
0
28
30
32
34
36
Salinity
[Hg] (pmol l )
_ 1
[Cd] (nmol l
)
_ 1
1.2
1.0
0.8
0.6
0.4
0.2
0
28
30
32
34
36
Salinity
(A)
(B)
3
2
1
0
28
30
32
34
36
Salinity
0.4
0.6
0.8
1.0
[Pb] (spring) (nmol l )
_ 1
[Pb] (winter) (nmol l )
_ 1
0.2
0
(C)
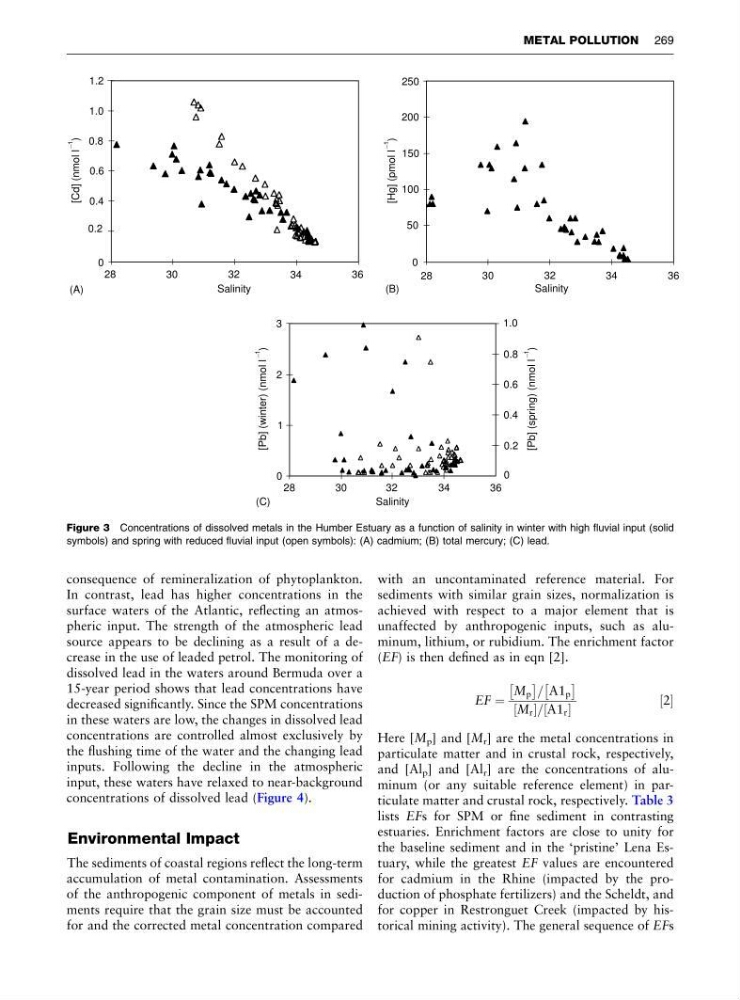
Figure 3 Concentrations of dissolved metals in the Humber Estuary as a function of salinity in winter with high fluvial input (solid
symbols) and spring with reduced fluvial input (open symbols): (A) cadmium; (B) total mercury; (C) lead.
METAL POLLUTION 269
In contrast, lead has higher concentrations in the
surface waters of the Atlantic, reflecting an atmospheric input. The strength of the atmospheric lead
source appears to be declining as a result of a decrease in the use of leaded petrol. The monitoring of
dissolved lead in the waters around Bermuda over a
15-year period shows that lead concentrations have
decreased significantly. Since the SPM concentrations
in these waters are low, the changes in dissolved lead
concentrations are controlled almost exclusively by
the flushing time of the water and the changing lead
inputs. Following the decline in the atmospheric
input, these waters have relaxed to near-background
concentrations of dissolved lead (Figure 4).
Environmental Impact
The sediments of coastal regions reflect the long-term
accumulation of metal contamination. Assessments
of the anthropogenic component of metals in sediments require that the grain size must be accounted
for and the corrected metal concentration compared
with an uncontaminated reference material. For
sediments with similar grain sizes, normalization is
achieved with respect to a major element that is
unaffected by anthropogenic inputs, such as aluminum, lithium, or rubidium. The enrichment factor
(EF) is then defined as in eqn [2].
EF ¼
M p
 Ã
= A1 p
Â
Ã
M r
½ = A1 r
½
½2
Here [M p ] and [M r ] are the metal concentrations in
particulate matter and in crustal rock, respectively,
and [Al p ] and [Al r ] are the concentrations of aluminum (or any suitable reference element) in particulate matter and crustal rock, respectively. Table 3
lists EFs for SPM or fine sediment in contrasting
estuaries. Enrichment factors are close to unity for
the baseline sediment and in the ‘pristine’ Lena Estuary, while the greatest EF values are encountered
for cadmium in the Rhine (impacted by the production of phosphate fertilizers) and the Scheldt, and
for copper in Restronguet Creek (impacted by historical mining activity). The general sequence of EFs
250
200
150
100
50
0
28
30
32
34
36
Salinity
[Hg] (pmol l )
_ 1
[Cd] (nmol l
)
_ 1
1.2
1.0
0.8
0.6
0.4
0.2
0
28
30
32
34
36
Salinity
(A)
(B)
3
2
1
0
28
30
32
34
36
Salinity
0.4
0.6
0.8
1.0
[Pb] (spring) (nmol l )
_ 1
[Pb] (winter) (nmol l )
_ 1
0.2
0
(C)
Figure 3 Concentrations of dissolved metals in the Humber Estuary as a function of salinity in winter with high fluvial input (solid
symbols) and spring with reduced fluvial input (open symbols): (A) cadmium; (B) total mercury; (C) lead.
METAL POLLUTION 269