

Examples of Applications
Lipid Biomarkers in Santa Monica Basin Sediments
As one example of the application of single-compound
radiocarbon analysis, we show a detailed data set for a
range of lipid biomarkers extracted from marine
sediments. This work focused on the upper few
centimeters of a core from Santa Monica Basin. The
basin has a high sedimentation rate, and its suboxic
bottom waters inhibit bioturbation. As a result,
laminated cores recovered from the basin depocenter
allow decadal resolution of recent changes in the
14
C
record. On the timescale of radiocarbon decay, these
samples are contemporary and have no in situ
14
C
decay. However, the D
14 C values of the end-member
carbon sources have changed (Figure 2A, B).
‘Bomb14
C’ D
14 C ; has invaded the modern surface
ocean phytoplankton and the terrestrial biota, and
through subsequent sedimentation of their organic
detritus, this bomb14
C is carried to the underlying
sediments. The contrast between ‘pre-bomb’ D
14 C ;
and ‘post-bomb’ D
14 C ; D
14 C values, or the relative
rate of bomb14
C uptake, therefore is a useful tracer
property. It can help distinguish biogeochemical processes that transfer carbon within years or decades
(source-specific lipids that now contain bomb14
C)
from biogeochemical processes that do not exchange
with atmospheric CO 2 on a short timescale (lipids that
remain free from bomb14
C).
Compound-specific D
14 C values for 31 different
lipid biomarker molecules are shown in Figure 8 for
sedimentary horizons corresponding to pre-bomb
(before AD 1950) and post-bomb (1950–1996) eras.
These organic compounds represent phytoplanktonic, zooplanktonic, bacterial, archaeal, terrestrial
higher plant, and fossil carbon sources. The lipid
classes include long-chain n-alkanes, alkanoic (fatty)
acids, n-alcohols, C 30 mid-chain ketols and diols,
sterols, hopanols, and C 40 isoprenoid side chains of
the ether-linked glycerols of the Archaea.
The data show that the carbon source for the majority of the analyzed biomarkers is marine euphotic
Computer
Autosampler
controller
Preparative
unit
controller
CIS
controller
FID
Capillary column
Effluent
splitter
99% 1%
CIS
Sample vial tray
Autosampler
Preparative device
Helium (in)
320 ˚ C
Waste
trap
_ 20 ˚ C
Coolant Sample traps
Gas chromatograph
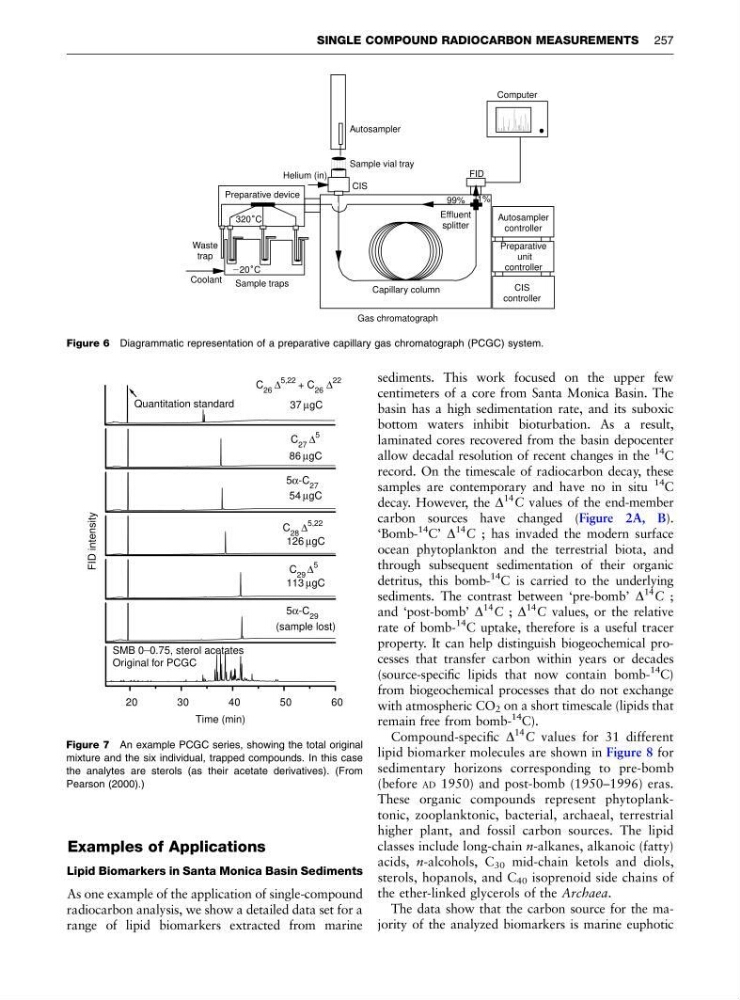
Figure 6 Diagrammatic representation of a preparative capillary gas chromatograph (PCGC) system.
20
30
40
50
60
C 26 Δ
5,22 + C 26 Δ
22
Quantitation standard
C 27 Δ
5
86 μgC
5α-C 27
54 μgC
C 28 Δ
5,22
126 μgC
C 29 Δ
5
113 μgC
(sample lost)
5α-C 29
SMB 0 _ 0.75, sterol acetates
Original for PCGC
Time (min)
FID
intensity
37 μgC
Figure 7 An example PCGC series, showing the total original
mixture and the six individual, trapped compounds. In this case
the analytes are sterols (as their acetate derivatives). (From
Pearson (2000).)
SINGLE COMPOUND RADIOCARBON MEASUREMENTS 257
Lipid Biomarkers in Santa Monica Basin Sediments
As one example of the application of single-compound
radiocarbon analysis, we show a detailed data set for a
range of lipid biomarkers extracted from marine
sediments. This work focused on the upper few
centimeters of a core from Santa Monica Basin. The
basin has a high sedimentation rate, and its suboxic
bottom waters inhibit bioturbation. As a result,
laminated cores recovered from the basin depocenter
allow decadal resolution of recent changes in the
14
C
record. On the timescale of radiocarbon decay, these
samples are contemporary and have no in situ
14
C
decay. However, the D
14 C values of the end-member
carbon sources have changed (Figure 2A, B).
‘Bomb14
C’ D
14 C ; has invaded the modern surface
ocean phytoplankton and the terrestrial biota, and
through subsequent sedimentation of their organic
detritus, this bomb14
C is carried to the underlying
sediments. The contrast between ‘pre-bomb’ D
14 C ;
and ‘post-bomb’ D
14 C ; D
14 C values, or the relative
rate of bomb14
C uptake, therefore is a useful tracer
property. It can help distinguish biogeochemical processes that transfer carbon within years or decades
(source-specific lipids that now contain bomb14
C)
from biogeochemical processes that do not exchange
with atmospheric CO 2 on a short timescale (lipids that
remain free from bomb14
C).
Compound-specific D
14 C values for 31 different
lipid biomarker molecules are shown in Figure 8 for
sedimentary horizons corresponding to pre-bomb
(before AD 1950) and post-bomb (1950–1996) eras.
These organic compounds represent phytoplanktonic, zooplanktonic, bacterial, archaeal, terrestrial
higher plant, and fossil carbon sources. The lipid
classes include long-chain n-alkanes, alkanoic (fatty)
acids, n-alcohols, C 30 mid-chain ketols and diols,
sterols, hopanols, and C 40 isoprenoid side chains of
the ether-linked glycerols of the Archaea.
The data show that the carbon source for the majority of the analyzed biomarkers is marine euphotic
Computer
Autosampler
controller
Preparative
unit
controller
CIS
controller
FID
Capillary column
Effluent
splitter
99% 1%
CIS
Sample vial tray
Autosampler
Preparative device
Helium (in)
320 ˚ C
Waste
trap
_ 20 ˚ C
Coolant Sample traps
Gas chromatograph
Figure 6 Diagrammatic representation of a preparative capillary gas chromatograph (PCGC) system.
20
30
40
50
60
C 26 Δ
5,22 + C 26 Δ
22
Quantitation standard
C 27 Δ
5
86 μgC
5α-C 27
54 μgC
C 28 Δ
5,22
126 μgC
C 29 Δ
5
113 μgC
(sample lost)
5α-C 29
SMB 0 _ 0.75, sterol acetates
Original for PCGC
Time (min)
FID
intensity
37 μgC
Figure 7 An example PCGC series, showing the total original
mixture and the six individual, trapped compounds. In this case
the analytes are sterols (as their acetate derivatives). (From
Pearson (2000).)
SINGLE COMPOUND RADIOCARBON MEASUREMENTS 257