

99% is diverted to the collection system. The traps are
programmed to receive compounds of interest on the
basis of chromatographic retention time windows determined from the FID trace. Computerized synchronization of the trapping times permits collection
of multiple identical runs (often4100 consecutive injections). Using PCGC, baseline resolution of peaks
can be achieved at concentrations4100-fold higher
than typical analytical GC conditions, allowing up to
5 mg of carbon per chromatographic peak, per injection, to be separated (to achieve greater resolution,
typical loadings are usually about 1 mg of carbon per
peak). An example of a typical PCGC separation is
shown in Figure 7, where B40–130 mg of individual
sterols (as their acetate derivatives) were resolved and
isolated from a total sterol fraction obtained from
Santa Monica Basin surface sediment.
Another practical means of isolating individual
components from compound mixtures is highperformance liquid chromatography (HPLC). While
the resolving power of HPLC is lower, this technique
is particularly suited to polar, nonvolatile, or thermally unstable analytes that are difficult to separate
by GC. It also offers higher loading capacity than
capillary GC.
In addition to chromatographic resolution and
capacity, two additional aspects that require consideration are the potential for contamination of the
analytes during the isolation procedure, and
corrections for carbon associated with any derivative
groups that have been appended to the molecule
of interest. Regarding the former, entrainment
‘bleed’ D
14 C ; of chromatographic stationary phase
can result in significant carbon contamination of the
isolated compound, unless steps are taken to avoid
this problem (e.g., use of ultra-low bleed GC columns, removal of contaminants after the chromatographic isolation). This problem is likely to be most
acute in HPLC when reversed-phase chromatographic phases are used. Comparison of yields and
the D
13 C compositions of the isolated compound
and the CO 2 resulting from its combustion are
effective means of assessing potential contamination
problems.
AMS Measurement of
14
C
The purified compounds are sealed in evacuated
quartz tubes with CuO as an oxidant. The material is
combusted to CO 2 , purified, and then reduced to
graphite over cobalt or iron catalyst. The mixture of
graphite and catalyst is loaded into a cesium sputter
ion source.
14 C-AMS analysis is performed using
special methods necessary for the accurate determination of D
14 C in samples containing only
micrograms, rather than milligrams, of carbon. AMS
targets containing o150 mg of carbon are prone to
machine-induced isotopic fractionation, which appears to be directly related to the lower levels of
carbon ion current generated by these samples.
Therefore, small samples are analyzed with identically prepared, size-matched small standards to
compensate for these effects. The f m values that are
calculated relative to these standards no longer show
a size-dependent fractionation.
11000
9000
7000
1400
1200
1000
800
600
400
200
0
Compound type
Bulk
phases
n-Alkanes
Hopanoid
alkenes
Steroid
alkenes
Isoprenoid
alkenes
Fossil
carbon
Bacteria
Phytoplankton
(generic)
Diatoms
Total
lipids
Total
organic
carbon
Carbon-14 age (years before present)
Diatoms
isoprenoid alkenes
Phytoplankton
steroid alkenes
Bacteria
hopanoid alkenes
Fossil carbon
n-alkanes
Gas chromatogram of
lipids from sediment
Gas chromatogram of
isolated compound
Combustion
Reduction
Accelerator mass
spectrometer
Carbon dioxide
Graphite
Preparative capillary
gas chromatograph
13
C
14
C
12
C
Land
Ocean
Sediment
Eroded soils
and sediments
Phytoplankton
Bacteria
Sample
taken
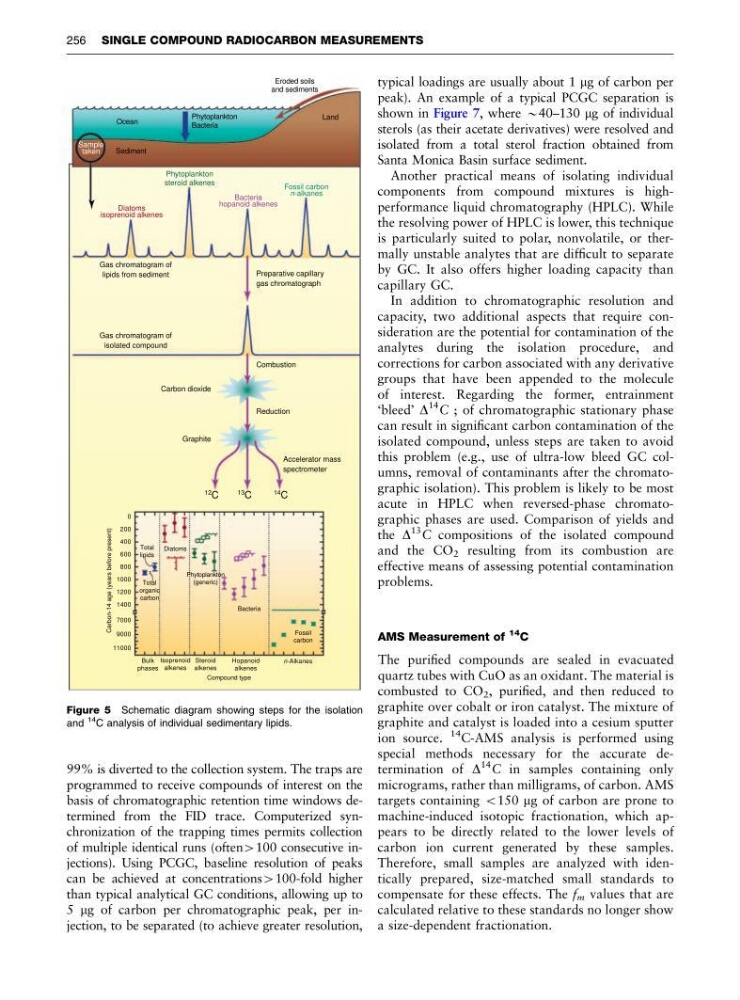
Figure 5 Schematic diagram showing steps for the isolation
and
14
C analysis of individual sedimentary lipids.
256 SINGLE COMPOUND RADIOCARBON MEASUREMENTS
programmed to receive compounds of interest on the
basis of chromatographic retention time windows determined from the FID trace. Computerized synchronization of the trapping times permits collection
of multiple identical runs (often4100 consecutive injections). Using PCGC, baseline resolution of peaks
can be achieved at concentrations4100-fold higher
than typical analytical GC conditions, allowing up to
5 mg of carbon per chromatographic peak, per injection, to be separated (to achieve greater resolution,
typical loadings are usually about 1 mg of carbon per
peak). An example of a typical PCGC separation is
shown in Figure 7, where B40–130 mg of individual
sterols (as their acetate derivatives) were resolved and
isolated from a total sterol fraction obtained from
Santa Monica Basin surface sediment.
Another practical means of isolating individual
components from compound mixtures is highperformance liquid chromatography (HPLC). While
the resolving power of HPLC is lower, this technique
is particularly suited to polar, nonvolatile, or thermally unstable analytes that are difficult to separate
by GC. It also offers higher loading capacity than
capillary GC.
In addition to chromatographic resolution and
capacity, two additional aspects that require consideration are the potential for contamination of the
analytes during the isolation procedure, and
corrections for carbon associated with any derivative
groups that have been appended to the molecule
of interest. Regarding the former, entrainment
‘bleed’ D
14 C ; of chromatographic stationary phase
can result in significant carbon contamination of the
isolated compound, unless steps are taken to avoid
this problem (e.g., use of ultra-low bleed GC columns, removal of contaminants after the chromatographic isolation). This problem is likely to be most
acute in HPLC when reversed-phase chromatographic phases are used. Comparison of yields and
the D
13 C compositions of the isolated compound
and the CO 2 resulting from its combustion are
effective means of assessing potential contamination
problems.
AMS Measurement of
14
C
The purified compounds are sealed in evacuated
quartz tubes with CuO as an oxidant. The material is
combusted to CO 2 , purified, and then reduced to
graphite over cobalt or iron catalyst. The mixture of
graphite and catalyst is loaded into a cesium sputter
ion source.
14 C-AMS analysis is performed using
special methods necessary for the accurate determination of D
14 C in samples containing only
micrograms, rather than milligrams, of carbon. AMS
targets containing o150 mg of carbon are prone to
machine-induced isotopic fractionation, which appears to be directly related to the lower levels of
carbon ion current generated by these samples.
Therefore, small samples are analyzed with identically prepared, size-matched small standards to
compensate for these effects. The f m values that are
calculated relative to these standards no longer show
a size-dependent fractionation.
11000
9000
7000
1400
1200
1000
800
600
400
200
0
Compound type
Bulk
phases
n-Alkanes
Hopanoid
alkenes
Steroid
alkenes
Isoprenoid
alkenes
Fossil
carbon
Bacteria
Phytoplankton
(generic)
Diatoms
Total
lipids
Total
organic
carbon
Carbon-14 age (years before present)
Diatoms
isoprenoid alkenes
Phytoplankton
steroid alkenes
Bacteria
hopanoid alkenes
Fossil carbon
n-alkanes
Gas chromatogram of
lipids from sediment
Gas chromatogram of
isolated compound
Combustion
Reduction
Accelerator mass
spectrometer
Carbon dioxide
Graphite
Preparative capillary
gas chromatograph
13
C
14
C
12
C
Land
Ocean
Sediment
Eroded soils
and sediments
Phytoplankton
Bacteria
Sample
taken
Figure 5 Schematic diagram showing steps for the isolation
and
14
C analysis of individual sedimentary lipids.
256 SINGLE COMPOUND RADIOCARBON MEASUREMENTS