

model.
dC
dt
¼ Àv
dC
dx
þ K
d
2 C
dx 2
½4
In eqn [4] C is concentration, K is along-isopycnal
eddy diffusivity, À v is the southward component of
along isopycnal velocity, t is time, and x is the meridional distance. Upper-level isopycnal surfaces
outcrop at the surface. Once the model is calibrated,
the resulting values are used to investigate the distribution of other parameters. The original work and
the references cited there should be read for details,
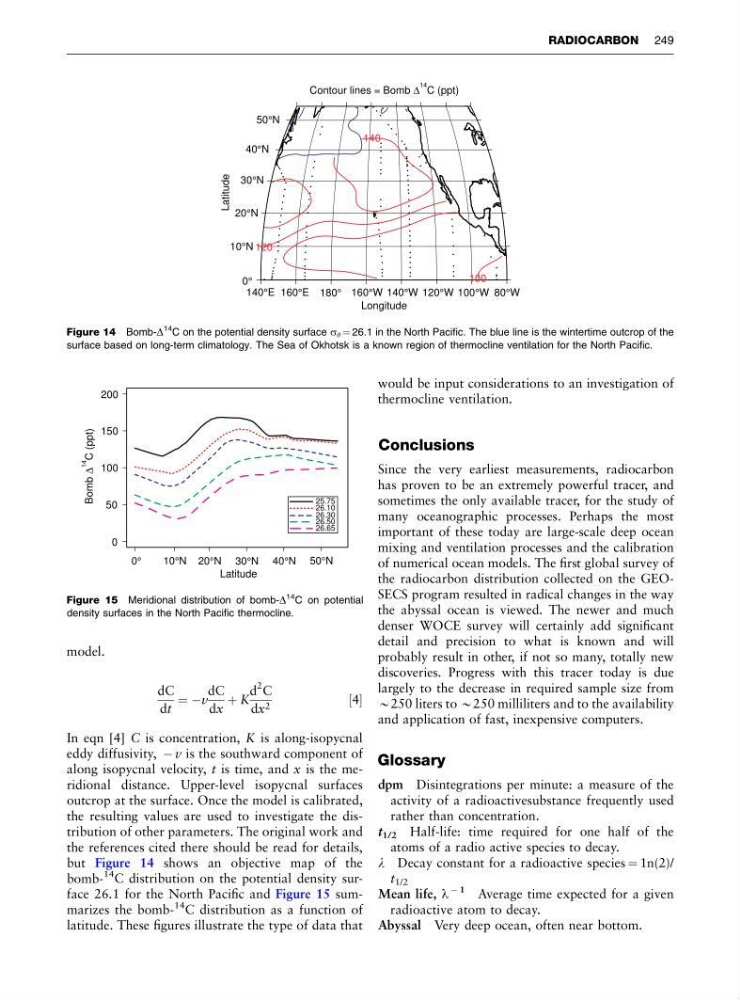
but Figure 14 shows an objective map of the
bomb14 C distribution on the potential density surface 26.1 for the North Pacific and Figure 15 summarizes the bomb14 C distribution as a function of
latitude. These figures illustrate the type of data that
would be input considerations to an investigation of
thermocline ventilation.
Conclusions
Since the very earliest measurements, radiocarbon
has proven to be an extremely powerful tracer, and
sometimes the only available tracer, for the study of
many oceanographic processes. Perhaps the most
important of these today are large-scale deep ocean
mixing and ventilation processes and the calibration
of numerical ocean models. The first global survey of
the radiocarbon distribution collected on the GEOSECS program resulted in radical changes in the way
the abyssal ocean is viewed. The newer and much
denser WOCE survey will certainly add significant
detail and precision to what is known and will
probably result in other, if not so many, totally new
discoveries. Progress with this tracer today is due
largely to the decrease in required sample size from
B250 liters to B250 milliliters and to the availability
and application of fast, inexpensive computers.
Glossary
dpm Disintegrations per minute: a measure of the
activity of a radioactivesubstance frequently used
rather than concentration.
t 1/2 Half-life: time required for one half of the
atoms of a radio active species to decay.
l Decay constant for a radioactive species ¼ 1n(2)/
t 1/2
Mean life, l
À 1
Average time expected for a given
radioactive atom to decay.
Abyssal Very deep ocean, often near bottom.
•
•
•
• • • • • •
•
•
•
•
•
•
•
•
•
•
•
•
•
•
•
•
•
•
•
•
•
•
• •
•
•
•
•
•
•
•
•
•
•
•
•
•
•
•
•
•
•
•
•
•
•
•
•
•
•
•
•
•
•
•
•
•
•
•
•
•
•
•
•
•
•
•
•
•
•
•
•
•
•
•
•
•
•
•
•
•
•
•
•
•
•
•
•
•
•
•
•
•
•
•
•
•
•
•
•
•
•
•
•
•
•
•
•
• •
•
•
•
•
•
•
•
•
•
• •
•
•
• •
0°
140°E
180°
160°E
160°W 140°W 120°W 100°W 80°W
10°N
20°N
30°N
40°N
50°N
Longitude
Latitude
Contour lines = Bomb
C (ppt)
Δ
14
100
120
140
Figure 14 Bomb-D
14 C on the potential density surface s y ¼ 26.1 in the North Pacific. The blue line is the wintertime outcrop of the
surface based on long-term climatology. The Sea of Okhotsk is a known region of thermocline ventilation for the North Pacific.
Latitude
0
100
150
200
25.75
26.10
26.30
26.50
26.65
10°N 20°N 30°N 40°N 50°N
50
Bomb C (ppt)
Δ
14
0°
Figure 15 Meridional distribution of bomb-D
14 C on potential
density surfaces in the North Pacific thermocline.
RADIOCARBON 249
dC
dt
¼ Àv
dC
dx
þ K
d
2 C
dx 2
½4
In eqn [4] C is concentration, K is along-isopycnal
eddy diffusivity, À v is the southward component of
along isopycnal velocity, t is time, and x is the meridional distance. Upper-level isopycnal surfaces
outcrop at the surface. Once the model is calibrated,
the resulting values are used to investigate the distribution of other parameters. The original work and
the references cited there should be read for details,
but Figure 14 shows an objective map of the
bomb14 C distribution on the potential density surface 26.1 for the North Pacific and Figure 15 summarizes the bomb14 C distribution as a function of
latitude. These figures illustrate the type of data that
would be input considerations to an investigation of
thermocline ventilation.
Conclusions
Since the very earliest measurements, radiocarbon
has proven to be an extremely powerful tracer, and
sometimes the only available tracer, for the study of
many oceanographic processes. Perhaps the most
important of these today are large-scale deep ocean
mixing and ventilation processes and the calibration
of numerical ocean models. The first global survey of
the radiocarbon distribution collected on the GEOSECS program resulted in radical changes in the way
the abyssal ocean is viewed. The newer and much
denser WOCE survey will certainly add significant
detail and precision to what is known and will
probably result in other, if not so many, totally new
discoveries. Progress with this tracer today is due
largely to the decrease in required sample size from
B250 liters to B250 milliliters and to the availability
and application of fast, inexpensive computers.
Glossary
dpm Disintegrations per minute: a measure of the
activity of a radioactivesubstance frequently used
rather than concentration.
t 1/2 Half-life: time required for one half of the
atoms of a radio active species to decay.
l Decay constant for a radioactive species ¼ 1n(2)/
t 1/2
Mean life, l
À 1
Average time expected for a given
radioactive atom to decay.
Abyssal Very deep ocean, often near bottom.
•
•
•
• • • • • •
•
•
•
•
•
•
•
•
•
•
•
•
•
•
•
•
•
•
•
•
•
•
• •
•
•
•
•
•
•
•
•
•
•
•
•
•
•
•
•
•
•
•
•
•
•
•
•
•
•
•
•
•
•
•
•
•
•
•
•
•
•
•
•
•
•
•
•
•
•
•
•
•
•
•
•
•
•
•
•
•
•
•
•
•
•
•
•
•
•
•
•
•
•
•
•
•
•
•
•
•
•
•
•
•
•
•
•
• •
•
•
•
•
•
•
•
•
•
• •
•
•
• •
0°
140°E
180°
160°E
160°W 140°W 120°W 100°W 80°W
10°N
20°N
30°N
40°N
50°N
Longitude
Latitude
Contour lines = Bomb
C (ppt)
Δ
14
100
120
140
Figure 14 Bomb-D
14 C on the potential density surface s y ¼ 26.1 in the North Pacific. The blue line is the wintertime outcrop of the
surface based on long-term climatology. The Sea of Okhotsk is a known region of thermocline ventilation for the North Pacific.
Latitude
0
100
150
200
25.75
26.10
26.30
26.50
26.65
10°N 20°N 30°N 40°N 50°N
50
Bomb C (ppt)
Δ
14
0°
Figure 15 Meridional distribution of bomb-D
14 C on potential
density surfaces in the North Pacific thermocline.
RADIOCARBON 249