

Separating the Natural and Bomb
Components
Up to this point the discussion has been limited to
changes in radiocarbon distribution due to oceanic
uptake of bomb-produced radiocarbon. Many
radiocarbon applications, however, require not the
change but the distribution of either bomb or natural
radiocarbon. Ocean water measurements give the
total of natural plus bomb-produced D
14 C. Since
these two are chemically and physically identical, no
analytical procedure can differentiate one from the
other. Far too few D
14 C measurements were made in
the upper ocean prior to contamination by the bomb
component for us to know what the upper ocean
natural D
14
C distribution was.
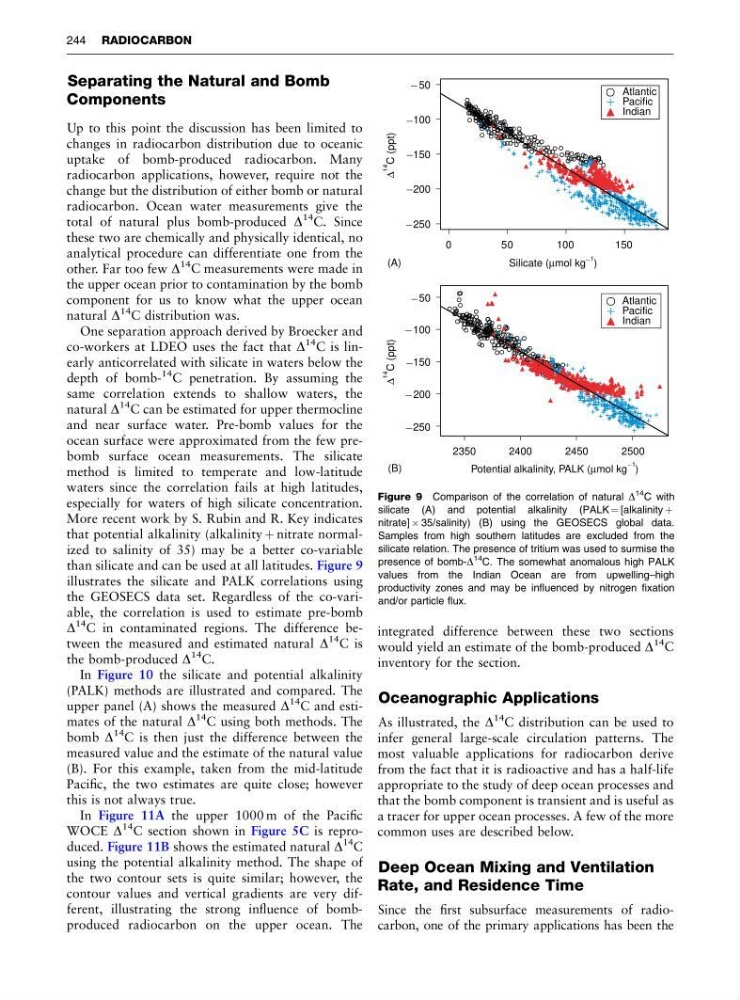
One separation approach derived by Broecker and
co-workers at LDEO uses the fact that D
14 C is linearly anticorrelated with silicate in waters below the
depth of bomb14 C penetration. By assuming the
same correlation extends to shallow waters, the
natural D
14 C can be estimated for upper thermocline
and near surface water. Pre-bomb values for the
ocean surface were approximated from the few prebomb surface ocean measurements. The silicate
method is limited to temperate and low-latitude
waters since the correlation fails at high latitudes,
especially for waters of high silicate concentration.
More recent work by S. Rubin and R. Key indicates
that potential alkalinity (alkalinity þ nitrate normalized to salinity of 35) may be a better co-variable
than silicate and can be used at all latitudes. Figure 9
illustrates the silicate and PALK correlations using
the GEOSECS data set. Regardless of the co-variable, the correlation is used to estimate pre-bomb
D
14 C in contaminated regions. The difference between the measured and estimated natural D
14 C is
the bomb-produced D
14
C.
In Figure 10 the silicate and potential alkalinity
(PALK) methods are illustrated and compared. The
upper panel (A) shows the measured D
14
C and estimates of the natural D
14 C using both methods. The
bomb D
14
C is then just the difference between the
measured value and the estimate of the natural value
(B). For this example, taken from the mid-latitude
Pacific, the two estimates are quite close; however
this is not always true.
In Figure 11A the upper 1000 m of the Pacific
WOCE D
14 C section shown in Figure 5C is reproduced. Figure 11B shows the estimated natural D
14
C
using the potential alkalinity method. The shape of
the two contour sets is quite similar; however, the
contour values and vertical gradients are very different, illustrating the strong influence of bombproduced radiocarbon on the upper ocean. The
integrated difference between these two sections
would yield an estimate of the bomb-produced D
14
C
inventory for the section.
Oceanographic Applications
As illustrated, the D
14
C distribution can be used to
infer general large-scale circulation patterns. The
most valuable applications for radiocarbon derive
from the fact that it is radioactive and has a half-life
appropriate to the study of deep ocean processes and
that the bomb component is transient and is useful as
a tracer for upper ocean processes. A few of the more
common uses are described below.
Deep Ocean Mixing and Ventilation
Rate, and Residence Time
Since the first subsurface measurements of radiocarbon, one of the primary applications has been the
Silicate ( mol kg )
μ
_ 1
0
50
100
150
Atlantic
Pacific
Indian
2350
2400
2450
2500
Atlantic
Pacific
Indian
Δ
14
C (ppt)
Δ
14
C (ppt)
(A)
(B)
Potential alkalinity, PALK ( mol kg )
μ
_ 1
_ 250
_ 150
_ 50
_ 250
_ 150
_ 50
_ 200
_ 100
_ 200
_ 100
Figure 9 Comparison of the correlation of natural D
14 C with
silicate (A) and potential alkalinity (PALK ¼ [alkalinity þ
nitrate] Â 35/salinity) (B) using the GEOSECS global data.
Samples from high southern latitudes are excluded from the
silicate relation. The presence of tritium was used to surmise the
presence of bomb-D
14 C. The somewhat anomalous high PALK
values from the Indian Ocean are from upwelling–high
productivity zones and may be influenced by nitrogen fixation
and/or particle flux.
244 RADIOCARBON
Components
Up to this point the discussion has been limited to
changes in radiocarbon distribution due to oceanic
uptake of bomb-produced radiocarbon. Many
radiocarbon applications, however, require not the
change but the distribution of either bomb or natural
radiocarbon. Ocean water measurements give the
total of natural plus bomb-produced D
14 C. Since
these two are chemically and physically identical, no
analytical procedure can differentiate one from the
other. Far too few D
14 C measurements were made in
the upper ocean prior to contamination by the bomb
component for us to know what the upper ocean
natural D
14
C distribution was.
One separation approach derived by Broecker and
co-workers at LDEO uses the fact that D
14 C is linearly anticorrelated with silicate in waters below the
depth of bomb14 C penetration. By assuming the
same correlation extends to shallow waters, the
natural D
14 C can be estimated for upper thermocline
and near surface water. Pre-bomb values for the
ocean surface were approximated from the few prebomb surface ocean measurements. The silicate
method is limited to temperate and low-latitude
waters since the correlation fails at high latitudes,
especially for waters of high silicate concentration.
More recent work by S. Rubin and R. Key indicates
that potential alkalinity (alkalinity þ nitrate normalized to salinity of 35) may be a better co-variable
than silicate and can be used at all latitudes. Figure 9
illustrates the silicate and PALK correlations using
the GEOSECS data set. Regardless of the co-variable, the correlation is used to estimate pre-bomb
D
14 C in contaminated regions. The difference between the measured and estimated natural D
14 C is
the bomb-produced D
14
C.
In Figure 10 the silicate and potential alkalinity
(PALK) methods are illustrated and compared. The
upper panel (A) shows the measured D
14
C and estimates of the natural D
14 C using both methods. The
bomb D
14
C is then just the difference between the
measured value and the estimate of the natural value
(B). For this example, taken from the mid-latitude
Pacific, the two estimates are quite close; however
this is not always true.
In Figure 11A the upper 1000 m of the Pacific
WOCE D
14 C section shown in Figure 5C is reproduced. Figure 11B shows the estimated natural D
14
C
using the potential alkalinity method. The shape of
the two contour sets is quite similar; however, the
contour values and vertical gradients are very different, illustrating the strong influence of bombproduced radiocarbon on the upper ocean. The
integrated difference between these two sections
would yield an estimate of the bomb-produced D
14
C
inventory for the section.
Oceanographic Applications
As illustrated, the D
14
C distribution can be used to
infer general large-scale circulation patterns. The
most valuable applications for radiocarbon derive
from the fact that it is radioactive and has a half-life
appropriate to the study of deep ocean processes and
that the bomb component is transient and is useful as
a tracer for upper ocean processes. A few of the more
common uses are described below.
Deep Ocean Mixing and Ventilation
Rate, and Residence Time
Since the first subsurface measurements of radiocarbon, one of the primary applications has been the
Silicate ( mol kg )
μ
_ 1
0
50
100
150
Atlantic
Pacific
Indian
2350
2400
2450
2500
Atlantic
Pacific
Indian
Δ
14
C (ppt)
Δ
14
C (ppt)
(A)
(B)
Potential alkalinity, PALK ( mol kg )
μ
_ 1
_ 250
_ 150
_ 50
_ 250
_ 150
_ 50
_ 200
_ 100
_ 200
_ 100
Figure 9 Comparison of the correlation of natural D
14 C with
silicate (A) and potential alkalinity (PALK ¼ [alkalinity þ
nitrate] Â 35/salinity) (B) using the GEOSECS global data.
Samples from high southern latitudes are excluded from the
silicate relation. The presence of tritium was used to surmise the
presence of bomb-D
14 C. The somewhat anomalous high PALK
values from the Indian Ocean are from upwelling–high
productivity zones and may be influenced by nitrogen fixation
and/or particle flux.
244 RADIOCARBON