

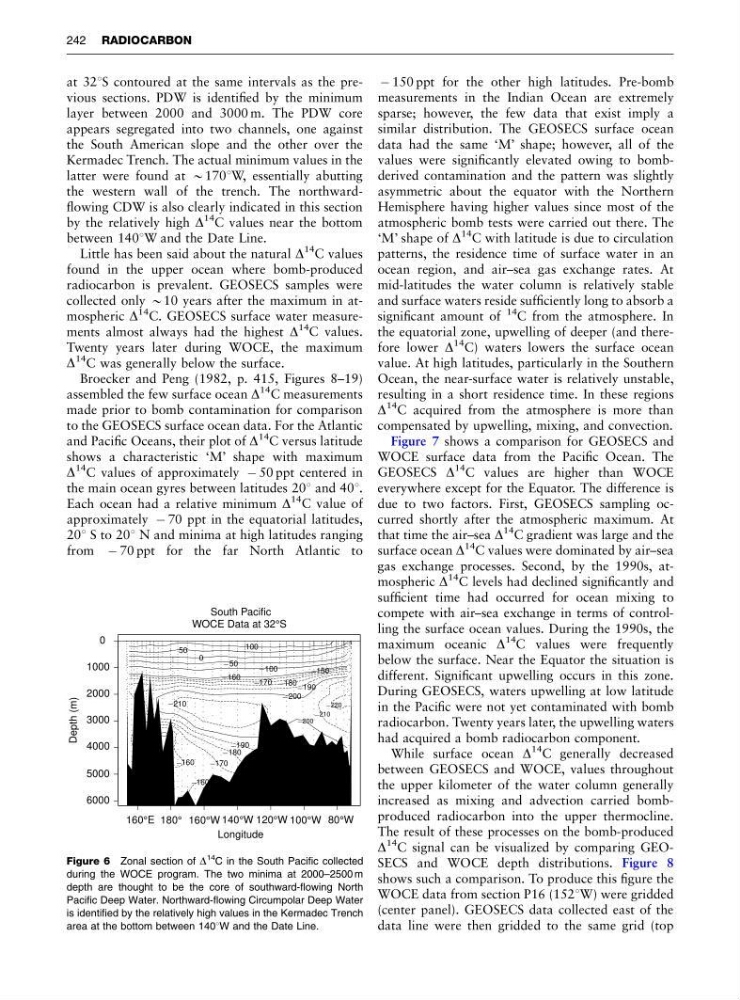
at 321S contoured at the same intervals as the previous sections. PDW is identified by the minimum
layer between 2000 and 3000 m. The PDW core
appears segregated into two channels, one against
the South American slope and the other over the
Kermadec Trench. The actual minimum values in the
latter were found at B1701W, essentially abutting
the western wall of the trench. The northwardflowing CDW is also clearly indicated in this section
by the relatively high D
14
C values near the bottom
between 1401W and the Date Line.
Little has been said about the natural D
14
C values
found in the upper ocean where bomb-produced
radiocarbon is prevalent. GEOSECS samples were
collected only B10 years after the maximum in atmospheric D
14 C. GEOSECS surface water measurements almost always had the highest D
14
C values.
Twenty years later during WOCE, the maximum
D
14 C was generally below the surface.
Broecker and Peng (1982, p. 415, Figures 8–19)
assembled the few surface ocean D
14 C measurements
made prior to bomb contamination for comparison
to the GEOSECS surface ocean data. For the Atlantic
and Pacific Oceans, their plot of D
14
C versus latitude
shows a characteristic ‘M’ shape with maximum
D
14 C values of approximately À 50 ppt centered in
the main ocean gyres between latitudes 201 and 401.
Each ocean had a relative minimum D
14 C value of
approximately À 70 ppt in the equatorial latitudes,
201 S to 201 N and minima at high latitudes ranging
from À 70 ppt for the far North Atlantic to
À 150 ppt for the other high latitudes. Pre-bomb
measurements in the Indian Ocean are extremely
sparse; however, the few data that exist imply a
similar distribution. The GEOSECS surface ocean
data had the same ‘M’ shape; however, all of the
values were significantly elevated owing to bombderived contamination and the pattern was slightly
asymmetric about the equator with the Northern
Hemisphere having higher values since most of the
atmospheric bomb tests were carried out there. The
‘M’ shape of D
14
C with latitude is due to circulation
patterns, the residence time of surface water in an
ocean region, and air–sea gas exchange rates. At
mid-latitudes the water column is relatively stable
and surface waters reside sufficiently long to absorb a
significant amount of
14
C from the atmosphere. In
the equatorial zone, upwelling of deeper (and therefore lower D
14 C) waters lowers the surface ocean
value. At high latitudes, particularly in the Southern
Ocean, the near-surface water is relatively unstable,
resulting in a short residence time. In these regions
D
14
C acquired from the atmosphere is more than
compensated by upwelling, mixing, and convection.
Figure 7 shows a comparison for GEOSECS and
WOCE surface data from the Pacific Ocean. The
GEOSECS D
14
C values are higher than WOCE
everywhere except for the Equator. The difference is
due to two factors. First, GEOSECS sampling occurred shortly after the atmospheric maximum. At
that time the air–sea D
14
C gradient was large and the
surface ocean D
14
C values were dominated by air–sea
gas exchange processes. Second, by the 1990s, atmospheric D
14
C levels had declined significantly and
sufficient time had occurred for ocean mixing to
compete with air–sea exchange in terms of controlling the surface ocean values. During the 1990s, the
maximum oceanic D
14
C values were frequently
below the surface. Near the Equator the situation is
different. Significant upwelling occurs in this zone.
During GEOSECS, waters upwelling at low latitude
in the Pacific were not yet contaminated with bomb
radiocarbon. Twenty years later, the upwelling waters
had acquired a bomb radiocarbon component.
While surface ocean D
14
C generally decreased
between GEOSECS and WOCE, values throughout
the upper kilometer of the water column generally
increased as mixing and advection carried bombproduced radiocarbon into the upper thermocline.
The result of these processes on the bomb-produced
D
14
C signal can be visualized by comparing GEOSECS and WOCE depth distributions. Figure 8
shows such a comparison. To produce this figure the
WOCE data from section P16 (1521W) were gridded
(center panel). GEOSECS data collected east of the
data line were then gridded to the same grid (top
South Pacific
WOCE Data at 32°S
Longitude
Depth (m)
160°E 180° 160°W 140°W 120°W 100°W 80°W
6000
5000
4000
3000
2000
1000
0
. . . . . . . . . . .
.
.
.
.
.
. .
. . . .
.
.
.
.
.
.
.
.
.
.
.
.
.
.
.
.
.
.
.
.
.
.
.
.
.
.
. .
. .
. . . .
. . . . . .
.
.
.
.
.
.
.
.
.
.
.
.
.
.
.
.
.
.
. . . .
. . . . . .
.
.
.
.
.
.
. . .
. . .
.
.
.
.
.
.
.. .. .. . .
.
.
.
.
. . .. . .
. .
. . .
. . .
. . . . .
. .
. .
.
. . . .
.. . . .
.
.
.
.
.. . .. . .. . .
. . .
.
.
.
.
.
.
.
.
.
.
. . . . . .
. . . .
.
.
.
. . .
.. ..
. . .
.
. . .
. .
. .
. .
.
.
.
.
.
.
.
. . .. . . .
. . . . .
. . .
.. . . .
. .
. .
. .
.
.
.
.
.
.
.
.
.
.
.
.
.
.
.
.
.
.
.
.
.
.
.
.
.
.
.
.
.
.
. . .
. . .
.
. . .
.
.
.
.
.
.
.
.
.
.
.
.
.
.
.
.
.
.
.
.
.
.
.
.
.
.
.
.
.
.
.
.
.
.
.
. .
. . . . .
. . . . .
.
.
.
.
.
.
.
.
.
.
.
.
.
.
.
.
.
..
.
. . .
. .
.
.
.
.
.
.
.
.
.
.
.
.
.
.
.
.
.
.
.
. . . . .
. .
.
.
.
.
.
.
.
.
.
.
.
.
.
.
.
.
.
.
.
.
.
.
. . ..
..
. .
.
.
.
.
.
.
.
.
.
.
.
.
.
.
.
.
.
.
.
. . . . .
. . .
. . . .
.
.
.
.
.
.
.
.
.
.
.
.
.
.
.
.
.
.
.
.
. .. .. ..
. . .
.
.
.
.
.
.
. . . . ..
. . . .
. . . . .
.
.
.
.
.
.
.
.
.
.
.
.
.
.
.
.
.
. . .. .. . . ..
.
.
. . . .
. . . . .
. . . . . . .
.
.
.
.
.
.
.
.
.
.
.
.
. .
. .
. . . ..
.
. . . .
. . . . . .
. . . . . .. . . .
.
. .
.
.
.
. .
.
.
.
.
.
.
. . . .. ..
. . .
.
. .
.
.. . . . .
. . .. . .
. .
. .
.
.
.
.
.
.
.
.. . . . . . . .
.
.
.
.
.
.
.
.. .. .. . . . .. .. . .. . . .
.
.
.
.
.
.
.
.
.
.
.
.
.
. . . . . . .
. .
.
.
.
.
.
.
. . . . . . . . . .. . .
.
.
. .
.
.
.
. .
.
.
.
.
.
.
.
.
.
.
.. . . .
.
. . ..
.
.
.
.
.
.
. . . . . ..
. . .
.
.
.
.
.
.
.. .. ..
. .
. . .
. .
.
.
. . . .. . .. . . . . .. . . . ..
. .
.
.
.
.
.
.
.
.
.
.
.
. .. . .
. . .
.
.
.
.
.
. .. . . ..
.
.
.
. . . .
.
.
. . . . . . .. . . . . .
. .
.
.
. .
.
.
. .
.
.
.
.
.. . . .
. .
.
.
.
.
.
.
.
.
. ..
. . .
.
.
.
.
.
. .
.
.
.
. ..
. . .
.
.
.
.
.
.
.
.
.
.
. . . .
.
.
. .
.
.
.
.
.
. . . .
.
.
.
.
.
.
.
.
..
.
.
.
.
.
.
.
. . ..
.
. . . . . . . . .
.
.
. .
.
.
.
.
.
.
.
.
.
.
.
.
.
.
.
.
_ 200
_ 200
_ 150
_ 100
_ 50
0
50
100
_ 220
_ 210
_ 210
_ 190
_ 180
_ 170
_ 160
_ 160
_ 190
_ 180
_ 170
_ 160
Figure 6 Zonal section of D
14
C in the South Pacific collected
during the WOCE program. The two minima at 2000–2500 m
depth are thought to be the core of southward-flowing North
Pacific Deep Water. Northward-flowing Circumpolar Deep Water
is identified by the relatively high values in the Kermadec Trench
area at the bottom between 1401W and the Date Line.
242 RADIOCARBON
layer between 2000 and 3000 m. The PDW core
appears segregated into two channels, one against
the South American slope and the other over the
Kermadec Trench. The actual minimum values in the
latter were found at B1701W, essentially abutting
the western wall of the trench. The northwardflowing CDW is also clearly indicated in this section
by the relatively high D
14
C values near the bottom
between 1401W and the Date Line.
Little has been said about the natural D
14
C values
found in the upper ocean where bomb-produced
radiocarbon is prevalent. GEOSECS samples were
collected only B10 years after the maximum in atmospheric D
14 C. GEOSECS surface water measurements almost always had the highest D
14
C values.
Twenty years later during WOCE, the maximum
D
14 C was generally below the surface.
Broecker and Peng (1982, p. 415, Figures 8–19)
assembled the few surface ocean D
14 C measurements
made prior to bomb contamination for comparison
to the GEOSECS surface ocean data. For the Atlantic
and Pacific Oceans, their plot of D
14
C versus latitude
shows a characteristic ‘M’ shape with maximum
D
14 C values of approximately À 50 ppt centered in
the main ocean gyres between latitudes 201 and 401.
Each ocean had a relative minimum D
14 C value of
approximately À 70 ppt in the equatorial latitudes,
201 S to 201 N and minima at high latitudes ranging
from À 70 ppt for the far North Atlantic to
À 150 ppt for the other high latitudes. Pre-bomb
measurements in the Indian Ocean are extremely
sparse; however, the few data that exist imply a
similar distribution. The GEOSECS surface ocean
data had the same ‘M’ shape; however, all of the
values were significantly elevated owing to bombderived contamination and the pattern was slightly
asymmetric about the equator with the Northern
Hemisphere having higher values since most of the
atmospheric bomb tests were carried out there. The
‘M’ shape of D
14
C with latitude is due to circulation
patterns, the residence time of surface water in an
ocean region, and air–sea gas exchange rates. At
mid-latitudes the water column is relatively stable
and surface waters reside sufficiently long to absorb a
significant amount of
14
C from the atmosphere. In
the equatorial zone, upwelling of deeper (and therefore lower D
14 C) waters lowers the surface ocean
value. At high latitudes, particularly in the Southern
Ocean, the near-surface water is relatively unstable,
resulting in a short residence time. In these regions
D
14
C acquired from the atmosphere is more than
compensated by upwelling, mixing, and convection.
Figure 7 shows a comparison for GEOSECS and
WOCE surface data from the Pacific Ocean. The
GEOSECS D
14
C values are higher than WOCE
everywhere except for the Equator. The difference is
due to two factors. First, GEOSECS sampling occurred shortly after the atmospheric maximum. At
that time the air–sea D
14
C gradient was large and the
surface ocean D
14
C values were dominated by air–sea
gas exchange processes. Second, by the 1990s, atmospheric D
14
C levels had declined significantly and
sufficient time had occurred for ocean mixing to
compete with air–sea exchange in terms of controlling the surface ocean values. During the 1990s, the
maximum oceanic D
14
C values were frequently
below the surface. Near the Equator the situation is
different. Significant upwelling occurs in this zone.
During GEOSECS, waters upwelling at low latitude
in the Pacific were not yet contaminated with bomb
radiocarbon. Twenty years later, the upwelling waters
had acquired a bomb radiocarbon component.
While surface ocean D
14
C generally decreased
between GEOSECS and WOCE, values throughout
the upper kilometer of the water column generally
increased as mixing and advection carried bombproduced radiocarbon into the upper thermocline.
The result of these processes on the bomb-produced
D
14
C signal can be visualized by comparing GEOSECS and WOCE depth distributions. Figure 8
shows such a comparison. To produce this figure the
WOCE data from section P16 (1521W) were gridded
(center panel). GEOSECS data collected east of the
data line were then gridded to the same grid (top
South Pacific
WOCE Data at 32°S
Longitude
Depth (m)
160°E 180° 160°W 140°W 120°W 100°W 80°W
6000
5000
4000
3000
2000
1000
0
. . . . . . . . . . .
.
.
.
.
.
. .
. . . .
.
.
.
.
.
.
.
.
.
.
.
.
.
.
.
.
.
.
.
.
.
.
.
.
.
.
. .
. .
. . . .
. . . . . .
.
.
.
.
.
.
.
.
.
.
.
.
.
.
.
.
.
.
. . . .
. . . . . .
.
.
.
.
.
.
. . .
. . .
.
.
.
.
.
.
.. .. .. . .
.
.
.
.
. . .. . .
. .
. . .
. . .
. . . . .
. .
. .
.
. . . .
.. . . .
.
.
.
.
.. . .. . .. . .
. . .
.
.
.
.
.
.
.
.
.
.
. . . . . .
. . . .
.
.
.
. . .
.. ..
. . .
.
. . .
. .
. .
. .
.
.
.
.
.
.
.
. . .. . . .
. . . . .
. . .
.. . . .
. .
. .
. .
.
.
.
.
.
.
.
.
.
.
.
.
.
.
.
.
.
.
.
.
.
.
.
.
.
.
.
.
.
.
. . .
. . .
.
. . .
.
.
.
.
.
.
.
.
.
.
.
.
.
.
.
.
.
.
.
.
.
.
.
.
.
.
.
.
.
.
.
.
.
.
.
. .
. . . . .
. . . . .
.
.
.
.
.
.
.
.
.
.
.
.
.
.
.
.
.
..
.
. . .
. .
.
.
.
.
.
.
.
.
.
.
.
.
.
.
.
.
.
.
.
. . . . .
. .
.
.
.
.
.
.
.
.
.
.
.
.
.
.
.
.
.
.
.
.
.
.
. . ..
..
. .
.
.
.
.
.
.
.
.
.
.
.
.
.
.
.
.
.
.
.
. . . . .
. . .
. . . .
.
.
.
.
.
.
.
.
.
.
.
.
.
.
.
.
.
.
.
.
. .. .. ..
. . .
.
.
.
.
.
.
. . . . ..
. . . .
. . . . .
.
.
.
.
.
.
.
.
.
.
.
.
.
.
.
.
.
. . .. .. . . ..
.
.
. . . .
. . . . .
. . . . . . .
.
.
.
.
.
.
.
.
.
.
.
.
. .
. .
. . . ..
.
. . . .
. . . . . .
. . . . . .. . . .
.
. .
.
.
.
. .
.
.
.
.
.
.
. . . .. ..
. . .
.
. .
.
.. . . . .
. . .. . .
. .
. .
.
.
.
.
.
.
.
.. . . . . . . .
.
.
.
.
.
.
.
.. .. .. . . . .. .. . .. . . .
.
.
.
.
.
.
.
.
.
.
.
.
.
. . . . . . .
. .
.
.
.
.
.
.
. . . . . . . . . .. . .
.
.
. .
.
.
.
. .
.
.
.
.
.
.
.
.
.
.
.. . . .
.
. . ..
.
.
.
.
.
.
. . . . . ..
. . .
.
.
.
.
.
.
.. .. ..
. .
. . .
. .
.
.
. . . .. . .. . . . . .. . . . ..
. .
.
.
.
.
.
.
.
.
.
.
.
. .. . .
. . .
.
.
.
.
.
. .. . . ..
.
.
.
. . . .
.
.
. . . . . . .. . . . . .
. .
.
.
. .
.
.
. .
.
.
.
.
.. . . .
. .
.
.
.
.
.
.
.
.
. ..
. . .
.
.
.
.
.
. .
.
.
.
. ..
. . .
.
.
.
.
.
.
.
.
.
.
. . . .
.
.
. .
.
.
.
.
.
. . . .
.
.
.
.
.
.
.
.
..
.
.
.
.
.
.
.
. . ..
.
. . . . . . . . .
.
.
. .
.
.
.
.
.
.
.
.
.
.
.
.
.
.
.
.
_ 200
_ 200
_ 150
_ 100
_ 50
0
50
100
_ 220
_ 210
_ 210
_ 190
_ 180
_ 170
_ 160
_ 160
_ 190
_ 180
_ 170
_ 160
Figure 6 Zonal section of D
14
C in the South Pacific collected
during the WOCE program. The two minima at 2000–2500 m
depth are thought to be the core of southward-flowing North
Pacific Deep Water. Northward-flowing Circumpolar Deep Water
is identified by the relatively high values in the Kermadec Trench
area at the bottom between 1401W and the Date Line.
242 RADIOCARBON