

Prior to 16 July 1945 all radiocarbon on the surface of the earth was produced naturally. On that
date, US scientists carried out the first atmospheric
atomic bomb test, known as the Trinity Test. Between 1945 and 1963, when the Partial Test Ban
Treaty was signed and atmospheric nuclear testing
was banned, approximately 500 atmospheric nuclear
explosions were carried out by the United States
(215), the former Soviet Union (219), the United
Kingdom (21) and France (50). After the signing, a
few additional atmospheric tests were carried out by
China (23) and other countries not participating in
the treaty. The net effect of the testing was to significantly increase
14 C levels in the atmosphere and
subsequently in the ocean. Anthropogenic
14 C has
also been added to the environment from some nuclear power plants, but this input is generally only
detectable near the reactor.
It is unusual to think of any type of atmospheric
contamination – especially by a radioactive species –
as beneficial; however, bomb-produced radiocarbon
(and tritium) has proven to be extremely valuable to
oceanographers. The majority of the atmospheric
testing, in terms of number of tests and
14 C production, occurred over a short time interval, between
1958 and 1963, relative to many ocean circulation
processes. This time history, coupled with the level of
contamination and the fact that
14
C becomes intimately involved in the oceanic carbon cycle, allows
bomb-produced radiocarbon to be valuable as a
tracer for several ocean processes including biological activity, air–sea gas exchange, thermocline
ventilation, upper ocean circulation, and upwelling.
Oceanographic radiocarbon results are generally
reported as D
14
C, the activity ratio relative to a
standard (NBS oxalic acid, 13.56 dpm per g of carbon) with a correction applied for dilution of the
radiocarbon by anthropogenic CO 2 with age corrections of the standard material to AD1950. D
14
C is
defined by eqn [1].
D
14 C ¼ d
14 C À 2ðd
13 C þ 25Þ 1 þ
d
14 C
1000
!
½1
d
14 C is given by eqn [2] and the definition of d
13 C is
analogous to that for d
14
C.
d
14 C ¼
14 C=C smp À
14 C=C
std
14 C=Cj std
"
#
 1000
½2
The first part of the second term in the right side of
eqn [1] 2(d
13 C þ 25), corrects for fractionation effects. The factor of 2 accounts for the fact that
14
C
fractionation is expected to be twice as much as for
13 C and the additive constant 25 is a normalization
factor conventionally applied to all samples and
based on the mean value of terrestrial wood. The
details of
14
C calculations can be significantly more
involved than expressed in the above equations;
however, there is a general consensus that the calculations and reporting of results be done as described by Minze Stuiver and Henry Polach in a
paper specifically written to eliminate differences
that existed previously. D
14
C has units of parts per
thousand (ppt). That is, 1 ppt means that
14 C/
12 C for
the sample is greater than
14 C/
12 C for the standard
by 0.001. In these units the radioactive decay rate of
14 C is approximately 1 ppt per 8.1 years.
The number of surface ocean measurements made
before any bomb-derived contamination are insufficient to provide the global distribution before input
from explosions. It is now possible to measure D
14
C
values in the annual growth rings of corals. By establishment of the exact year associated with each
ring, reconstruction of the surface ocean D
14
C history
is possible. Applying the same procedure to long-lived
mollusk shells extends the method to higher latitudes
than is possible with corals. Whether corals or shells
are used, it must be demonstrated that the coral or
shell incorporates
14
C in the same ratio as the water
in which it grew or at least that the fractionation is
known. This method works only over the depth range
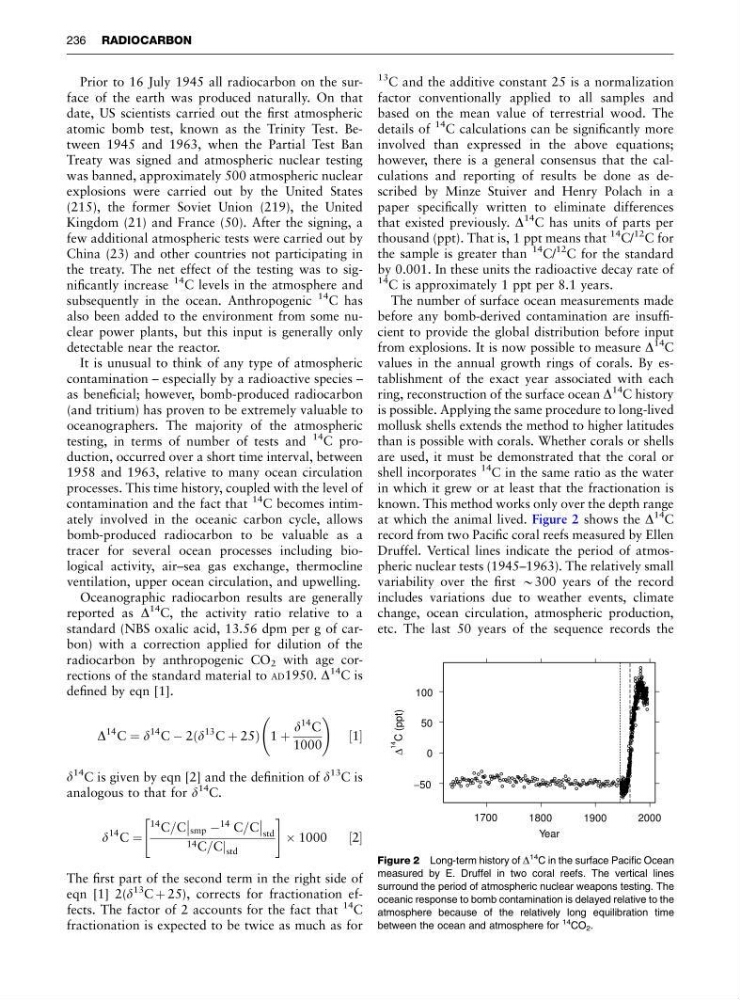
at which the animal lived. Figure 2 shows the D
14
C
record from two Pacific coral reefs measured by Ellen
Druffel. Vertical lines indicate the period of atmospheric nuclear tests (1945–1963). The relatively small
variability over the first B300 years of the record
includes variations due to weather events, climate
change, ocean circulation, atmospheric production,
etc. The last 50 years of the sequence records the
−50
0
50
100
1700
1800
1900
2000
Year
Δ
14
C (ppt)
Figure 2 Long-term history of D
14
C in the surface Pacific Ocean
measured by E. Druffel in two coral reefs. The vertical lines
surround the period of atmospheric nuclear weapons testing. The
oceanic response to bomb contamination is delayed relative to the
atmosphere because of the relatively long equilibration time
between the ocean and atmosphere for
14
CO 2 .
236 RADIOCARBON
date, US scientists carried out the first atmospheric
atomic bomb test, known as the Trinity Test. Between 1945 and 1963, when the Partial Test Ban
Treaty was signed and atmospheric nuclear testing
was banned, approximately 500 atmospheric nuclear
explosions were carried out by the United States
(215), the former Soviet Union (219), the United
Kingdom (21) and France (50). After the signing, a
few additional atmospheric tests were carried out by
China (23) and other countries not participating in
the treaty. The net effect of the testing was to significantly increase
14 C levels in the atmosphere and
subsequently in the ocean. Anthropogenic
14 C has
also been added to the environment from some nuclear power plants, but this input is generally only
detectable near the reactor.
It is unusual to think of any type of atmospheric
contamination – especially by a radioactive species –
as beneficial; however, bomb-produced radiocarbon
(and tritium) has proven to be extremely valuable to
oceanographers. The majority of the atmospheric
testing, in terms of number of tests and
14 C production, occurred over a short time interval, between
1958 and 1963, relative to many ocean circulation
processes. This time history, coupled with the level of
contamination and the fact that
14
C becomes intimately involved in the oceanic carbon cycle, allows
bomb-produced radiocarbon to be valuable as a
tracer for several ocean processes including biological activity, air–sea gas exchange, thermocline
ventilation, upper ocean circulation, and upwelling.
Oceanographic radiocarbon results are generally
reported as D
14
C, the activity ratio relative to a
standard (NBS oxalic acid, 13.56 dpm per g of carbon) with a correction applied for dilution of the
radiocarbon by anthropogenic CO 2 with age corrections of the standard material to AD1950. D
14
C is
defined by eqn [1].
D
14 C ¼ d
14 C À 2ðd
13 C þ 25Þ 1 þ
d
14 C
1000
!
½1
d
14 C is given by eqn [2] and the definition of d
13 C is
analogous to that for d
14
C.
d
14 C ¼
14 C=C smp À
14 C=C
std
14 C=Cj std
"
#
 1000
½2
The first part of the second term in the right side of
eqn [1] 2(d
13 C þ 25), corrects for fractionation effects. The factor of 2 accounts for the fact that
14
C
fractionation is expected to be twice as much as for
13 C and the additive constant 25 is a normalization
factor conventionally applied to all samples and
based on the mean value of terrestrial wood. The
details of
14
C calculations can be significantly more
involved than expressed in the above equations;
however, there is a general consensus that the calculations and reporting of results be done as described by Minze Stuiver and Henry Polach in a
paper specifically written to eliminate differences
that existed previously. D
14
C has units of parts per
thousand (ppt). That is, 1 ppt means that
14 C/
12 C for
the sample is greater than
14 C/
12 C for the standard
by 0.001. In these units the radioactive decay rate of
14 C is approximately 1 ppt per 8.1 years.
The number of surface ocean measurements made
before any bomb-derived contamination are insufficient to provide the global distribution before input
from explosions. It is now possible to measure D
14
C
values in the annual growth rings of corals. By establishment of the exact year associated with each
ring, reconstruction of the surface ocean D
14
C history
is possible. Applying the same procedure to long-lived
mollusk shells extends the method to higher latitudes
than is possible with corals. Whether corals or shells
are used, it must be demonstrated that the coral or
shell incorporates
14
C in the same ratio as the water
in which it grew or at least that the fractionation is
known. This method works only over the depth range
at which the animal lived. Figure 2 shows the D
14
C
record from two Pacific coral reefs measured by Ellen
Druffel. Vertical lines indicate the period of atmospheric nuclear tests (1945–1963). The relatively small
variability over the first B300 years of the record
includes variations due to weather events, climate
change, ocean circulation, atmospheric production,
etc. The last 50 years of the sequence records the
−50
0
50
100
1700
1800
1900
2000
Year
Δ
14
C (ppt)
Figure 2 Long-term history of D
14
C in the surface Pacific Ocean
measured by E. Druffel in two coral reefs. The vertical lines
surround the period of atmospheric nuclear weapons testing. The
oceanic response to bomb contamination is delayed relative to the
atmosphere because of the relatively long equilibration time
between the ocean and atmosphere for
14
CO 2 .
236 RADIOCARBON