

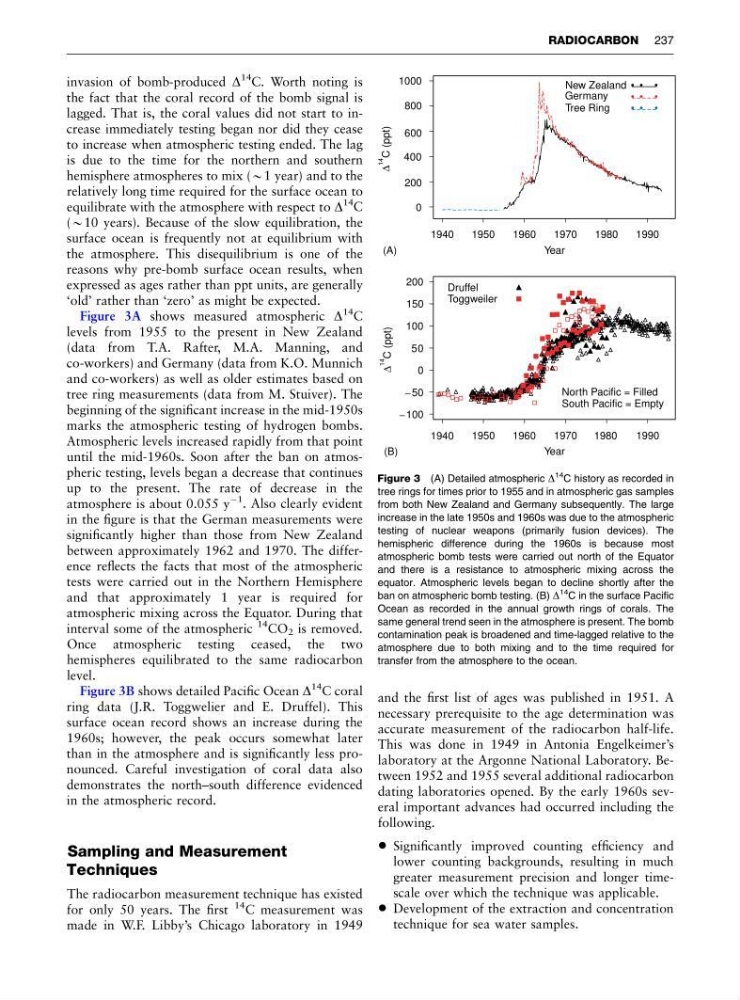
invasion of bomb-produced D
14
C. Worth noting is
the fact that the coral record of the bomb signal is
lagged. That is, the coral values did not start to increase immediately testing began nor did they cease
to increase when atmospheric testing ended. The lag
is due to the time for the northern and southern
hemisphere atmospheres to mix (B1 year) and to the
relatively long time required for the surface ocean to
equilibrate with the atmosphere with respect to D
14
C
(B10 years). Because of the slow equilibration, the
surface ocean is frequently not at equilibrium with
the atmosphere. This disequilibrium is one of the
reasons why pre-bomb surface ocean results, when
expressed as ages rather than ppt units, are generally
‘old’ rather than ‘zero’ as might be expected.
Figure 3A shows measured atmospheric D
14
C
levels from 1955 to the present in New Zealand
(data from T.A. Rafter, M.A. Manning, and
co-workers) and Germany (data from K.O. Munnich
and co-workers) as well as older estimates based on
tree ring measurements (data from M. Stuiver). The
beginning of the significant increase in the mid-1950s
marks the atmospheric testing of hydrogen bombs.
Atmospheric levels increased rapidly from that point
until the mid-1960s. Soon after the ban on atmospheric testing, levels began a decrease that continues
up to the present. The rate of decrease in the
atmosphere is about 0.055 y
À1
. Also clearly evident
in the figure is that the German measurements were
significantly higher than those from New Zealand
between approximately 1962 and 1970. The difference reflects the facts that most of the atmospheric
tests were carried out in the Northern Hemisphere
and that approximately 1 year is required for
atmospheric mixing across the Equator. During that
interval some of the atmospheric
14 CO 2 is removed.
Once atmospheric testing ceased, the two
hemispheres equilibrated to the same radiocarbon
level.
Figure 3B shows detailed Pacific Ocean D
14 C coral
ring data (J.R. Toggwelier and E. Druffel). This
surface ocean record shows an increase during the
1960s; however, the peak occurs somewhat later
than in the atmosphere and is significantly less pronounced. Careful investigation of coral data also
demonstrates the north–south difference evidenced
in the atmospheric record.
Sampling and Measurement
Techniques
The radiocarbon measurement technique has existed
for only 50 years. The first
14 C measurement was
made in W.F. Libby’s Chicago laboratory in 1949
and the first list of ages was published in 1951. A
necessary prerequisite to the age determination was
accurate measurement of the radiocarbon half-life.
This was done in 1949 in Antonia Engelkeimer’s
laboratory at the Argonne National Laboratory. Between 1952 and 1955 several additional radiocarbon
dating laboratories opened. By the early 1960s several important advances had occurred including the
following.
• Significantly improved counting efficiency and
lower counting backgrounds, resulting in much
greater measurement precision and longer timescale over which the technique was applicable.
• Development of the extraction and concentration
technique for sea water samples.
Year
1940
1950
1960
1970
1980
1990
0
200
600
1000
New Zealand
Germany
Tree Ring
• • •
• • •
• • •
Year
1940
1950
1960
1970
1980
1990
− 100
0
50
150
Druffel
Toggweiler
North Pacific = Filled
South Pacific = Empty
800
Δ
14
C (ppt)
400
− 50
200
100
Δ
14
C (ppt)
(A)
(B)
Figure 3 (A) Detailed atmospheric D
14 C history as recorded in
tree rings for times prior to 1955 and in atmospheric gas samples
from both New Zealand and Germany subsequently. The large
increase in the late 1950s and 1960s was due to the atmospheric
testing of nuclear weapons (primarily fusion devices). The
hemispheric difference during the 1960s is because most
atmospheric bomb tests were carried out north of the Equator
and there is a resistance to atmospheric mixing across the
equator. Atmospheric levels began to decline shortly after the
ban on atmospheric bomb testing. (B) D
14 C in the surface Pacific
Ocean as recorded in the annual growth rings of corals. The
same general trend seen in the atmosphere is present. The bomb
contamination peak is broadened and time-lagged relative to the
atmosphere due to both mixing and to the time required for
transfer from the atmosphere to the ocean.
RADIOCARBON 237
14
C. Worth noting is
the fact that the coral record of the bomb signal is
lagged. That is, the coral values did not start to increase immediately testing began nor did they cease
to increase when atmospheric testing ended. The lag
is due to the time for the northern and southern
hemisphere atmospheres to mix (B1 year) and to the
relatively long time required for the surface ocean to
equilibrate with the atmosphere with respect to D
14
C
(B10 years). Because of the slow equilibration, the
surface ocean is frequently not at equilibrium with
the atmosphere. This disequilibrium is one of the
reasons why pre-bomb surface ocean results, when
expressed as ages rather than ppt units, are generally
‘old’ rather than ‘zero’ as might be expected.
Figure 3A shows measured atmospheric D
14
C
levels from 1955 to the present in New Zealand
(data from T.A. Rafter, M.A. Manning, and
co-workers) and Germany (data from K.O. Munnich
and co-workers) as well as older estimates based on
tree ring measurements (data from M. Stuiver). The
beginning of the significant increase in the mid-1950s
marks the atmospheric testing of hydrogen bombs.
Atmospheric levels increased rapidly from that point
until the mid-1960s. Soon after the ban on atmospheric testing, levels began a decrease that continues
up to the present. The rate of decrease in the
atmosphere is about 0.055 y
À1
. Also clearly evident
in the figure is that the German measurements were
significantly higher than those from New Zealand
between approximately 1962 and 1970. The difference reflects the facts that most of the atmospheric
tests were carried out in the Northern Hemisphere
and that approximately 1 year is required for
atmospheric mixing across the Equator. During that
interval some of the atmospheric
14 CO 2 is removed.
Once atmospheric testing ceased, the two
hemispheres equilibrated to the same radiocarbon
level.
Figure 3B shows detailed Pacific Ocean D
14 C coral
ring data (J.R. Toggwelier and E. Druffel). This
surface ocean record shows an increase during the
1960s; however, the peak occurs somewhat later
than in the atmosphere and is significantly less pronounced. Careful investigation of coral data also
demonstrates the north–south difference evidenced
in the atmospheric record.
Sampling and Measurement
Techniques
The radiocarbon measurement technique has existed
for only 50 years. The first
14 C measurement was
made in W.F. Libby’s Chicago laboratory in 1949
and the first list of ages was published in 1951. A
necessary prerequisite to the age determination was
accurate measurement of the radiocarbon half-life.
This was done in 1949 in Antonia Engelkeimer’s
laboratory at the Argonne National Laboratory. Between 1952 and 1955 several additional radiocarbon
dating laboratories opened. By the early 1960s several important advances had occurred including the
following.
• Significantly improved counting efficiency and
lower counting backgrounds, resulting in much
greater measurement precision and longer timescale over which the technique was applicable.
• Development of the extraction and concentration
technique for sea water samples.
Year
1940
1950
1960
1970
1980
1990
0
200
600
1000
New Zealand
Germany
Tree Ring
• • •
• • •
• • •
Year
1940
1950
1960
1970
1980
1990
− 100
0
50
150
Druffel
Toggweiler
North Pacific = Filled
South Pacific = Empty
800
Δ
14
C (ppt)
400
− 50
200
100
Δ
14
C (ppt)
(A)
(B)
Figure 3 (A) Detailed atmospheric D
14 C history as recorded in
tree rings for times prior to 1955 and in atmospheric gas samples
from both New Zealand and Germany subsequently. The large
increase in the late 1950s and 1960s was due to the atmospheric
testing of nuclear weapons (primarily fusion devices). The
hemispheric difference during the 1960s is because most
atmospheric bomb tests were carried out north of the Equator
and there is a resistance to atmospheric mixing across the
equator. Atmospheric levels began to decline shortly after the
ban on atmospheric bomb testing. (B) D
14 C in the surface Pacific
Ocean as recorded in the annual growth rings of corals. The
same general trend seen in the atmosphere is present. The bomb
contamination peak is broadened and time-lagged relative to the
atmosphere due to both mixing and to the time required for
transfer from the atmosphere to the ocean.
RADIOCARBON 237