

the
222
Rn activity decreases exponentially with
height above bottom (Figure 11) which allows the
determination of eddy diffusion coefficient in these
waters. In these cases the
222
Rn distribution is assumed to be governed by the equation:
K
d
2 C
dz 2 À lC ¼ 0
½6
where K is the eddy diffusion coefficient and z height
above bottom with
222 Rn activity C. The values of K
calculated from the
222 Rn data span about two
orders of magnitude, 1–100 cm
2 s
À1
. Other types of
222 Rn profiles include those with a two-layer structure and those without specific trend suggesting that
its transport via advection and eddy diffusion along
isopycnals and non-steady-state condition also need
to be considered while describing its distribution.
These studies also demonstrated a strong dependence
between
222 Rn-based eddy diffusion and the stability
of bottom water column.
Ra Isotopes
Ra isotopes, particularly,
226
Ra and
228
Ra have
found extensive applications in water circulation
studies. All the Ra isotopes,
224 Ra,
223 Ra,
228 Ra, and
226 Ra enter the oceans mainly through diffusion
from sediments and by desorption from river particulates and are commonly measured by a and g
counting techniques.
224 Ra and
223 Ra, because of
their very short half-lives (Figure 1), are useful for
studying mixing processes occurring on timescales of
a few days to a few weeks which restricts their utility
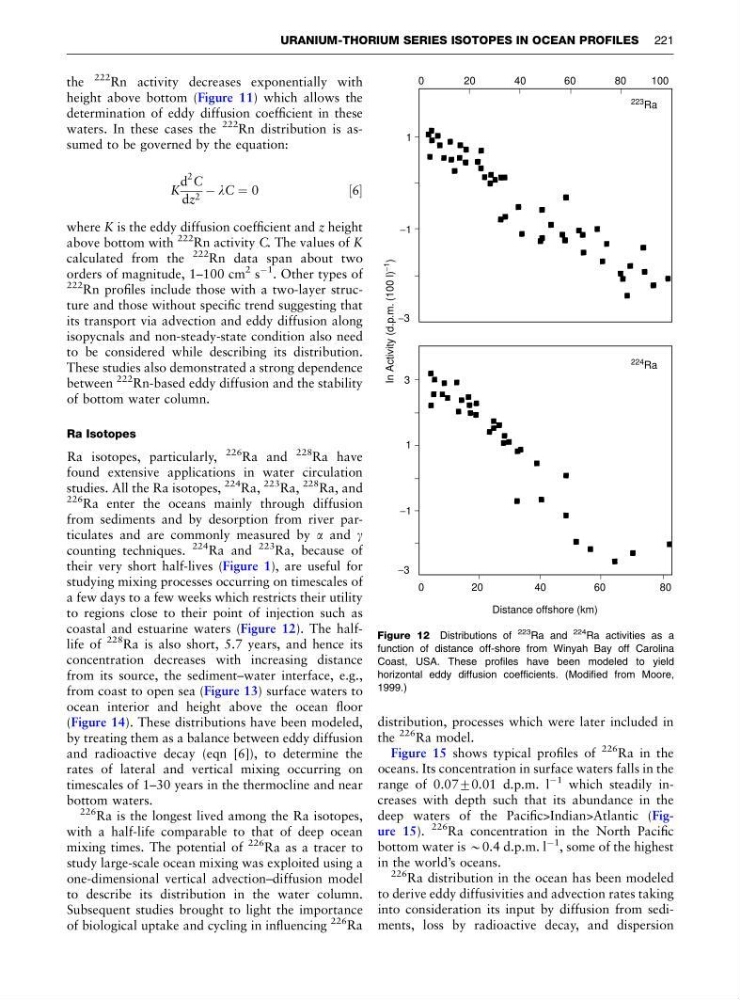
to regions close to their point of injection such as
coastal and estuarine waters (Figure 12). The halflife of
228
Ra is also short, 5.7 years, and hence its
concentration decreases with increasing distance
from its source, the sediment–water interface, e.g.,
from coast to open sea (Figure 13) surface waters to
ocean interior and height above the ocean floor
(Figure 14). These distributions have been modeled,
by treating them as a balance between eddy diffusion
and radioactive decay (eqn [6]), to determine the
rates of lateral and vertical mixing occurring on
timescales of 1–30 years in the thermocline and near
bottom waters.
226 Ra is the longest lived among the Ra isotopes,
with a half-life comparable to that of deep ocean
mixing times. The potential of
226 Ra as a tracer to
study large-scale ocean mixing was exploited using a
one-dimensional vertical advection–diffusion model
to describe its distribution in the water column.
Subsequent studies brought to light the importance
of biological uptake and cycling in influencing
226 Ra
distribution, processes which were later included in
the
226 Ra model.
Figure 15 shows typical profiles of
226 Ra in the
oceans. Its concentration in surface waters falls in the
range of 0.0770.01 d.p.m. l
À1 which steadily increases with depth such that its abundance in the
deep waters of the Pacific>Indian>Atlantic (Figure 15).
226 Ra concentration in the North Pacific
bottom water is B0.4 d.p.m. l
À1
, some of the highest
in the world’s oceans.
226 Ra distribution in the ocean has been modeled
to derive eddy diffusivities and advection rates taking
into consideration its input by diffusion from sediments, loss by radioactive decay, and dispersion
0
1
−1
−3
3
1
−1
−3
20
40
60
80
100
0
2 0
Distance offshore (km)
In Activity (d.p.m. (100 l)
−1
)
40
60
80
223
Ra
224
Ra
Figure 12 Distributions of
223 Ra and
224 Ra activities as a
function of distance off-shore from Winyah Bay off Carolina
Coast, USA. These profiles have been modeled to yield
horizontal eddy diffusion coefficients. (Modified from Moore,
1999.)
URANIUM-THORIUM SERIES ISOTOPES IN OCEAN PROFILES 221
222
Rn activity decreases exponentially with
height above bottom (Figure 11) which allows the
determination of eddy diffusion coefficient in these
waters. In these cases the
222
Rn distribution is assumed to be governed by the equation:
K
d
2 C
dz 2 À lC ¼ 0
½6
where K is the eddy diffusion coefficient and z height
above bottom with
222 Rn activity C. The values of K
calculated from the
222 Rn data span about two
orders of magnitude, 1–100 cm
2 s
À1
. Other types of
222 Rn profiles include those with a two-layer structure and those without specific trend suggesting that
its transport via advection and eddy diffusion along
isopycnals and non-steady-state condition also need
to be considered while describing its distribution.
These studies also demonstrated a strong dependence
between
222 Rn-based eddy diffusion and the stability
of bottom water column.
Ra Isotopes
Ra isotopes, particularly,
226
Ra and
228
Ra have
found extensive applications in water circulation
studies. All the Ra isotopes,
224 Ra,
223 Ra,
228 Ra, and
226 Ra enter the oceans mainly through diffusion
from sediments and by desorption from river particulates and are commonly measured by a and g
counting techniques.
224 Ra and
223 Ra, because of
their very short half-lives (Figure 1), are useful for
studying mixing processes occurring on timescales of
a few days to a few weeks which restricts their utility
to regions close to their point of injection such as
coastal and estuarine waters (Figure 12). The halflife of
228
Ra is also short, 5.7 years, and hence its
concentration decreases with increasing distance
from its source, the sediment–water interface, e.g.,
from coast to open sea (Figure 13) surface waters to
ocean interior and height above the ocean floor
(Figure 14). These distributions have been modeled,
by treating them as a balance between eddy diffusion
and radioactive decay (eqn [6]), to determine the
rates of lateral and vertical mixing occurring on
timescales of 1–30 years in the thermocline and near
bottom waters.
226 Ra is the longest lived among the Ra isotopes,
with a half-life comparable to that of deep ocean
mixing times. The potential of
226 Ra as a tracer to
study large-scale ocean mixing was exploited using a
one-dimensional vertical advection–diffusion model
to describe its distribution in the water column.
Subsequent studies brought to light the importance
of biological uptake and cycling in influencing
226 Ra
distribution, processes which were later included in
the
226 Ra model.
Figure 15 shows typical profiles of
226 Ra in the
oceans. Its concentration in surface waters falls in the
range of 0.0770.01 d.p.m. l
À1 which steadily increases with depth such that its abundance in the
deep waters of the Pacific>Indian>Atlantic (Figure 15).
226 Ra concentration in the North Pacific
bottom water is B0.4 d.p.m. l
À1
, some of the highest
in the world’s oceans.
226 Ra distribution in the ocean has been modeled
to derive eddy diffusivities and advection rates taking
into consideration its input by diffusion from sediments, loss by radioactive decay, and dispersion
0
1
−1
−3
3
1
−1
−3
20
40
60
80
100
0
2 0
Distance offshore (km)
In Activity (d.p.m. (100 l)
−1
)
40
60
80
223
Ra
224
Ra
Figure 12 Distributions of
223 Ra and
224 Ra activities as a
function of distance off-shore from Winyah Bay off Carolina
Coast, USA. These profiles have been modeled to yield
horizontal eddy diffusion coefficients. (Modified from Moore,
1999.)
URANIUM-THORIUM SERIES ISOTOPES IN OCEAN PROFILES 221