

measurements of settling fluxes of
230 Th and
231 Pa
using sediment traps and
230 Th/
231 Pa ratios in sediments from various oceanic regions support this
connection.
210 Po is supplied to sea almost entirely through its
in situ production from the decay of
210 Pb (Figure 1),
a minor contribution comes from its atmospheric
deposition at the air–sea interface.
210 Po is deficient
relative to
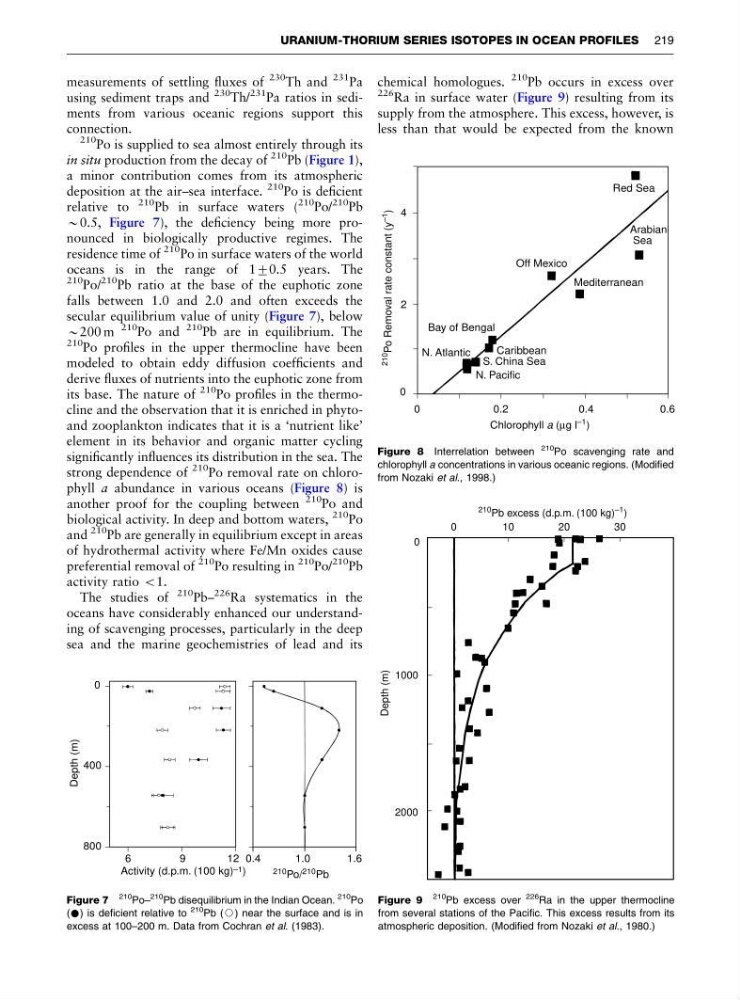
210 Pb in surface waters (
210
Po/
210 Pb
B0.5, Figure 7), the deficiency being more pronounced in biologically productive regimes. The
residence time of
210 Po in surface waters of the world
oceans is in the range of 170.5 years. The
210 Po/
210 Pb ratio at the base of the euphotic zone
falls between 1.0 and 2.0 and often exceeds the
secular equilibrium value of unity (Figure 7), below
B200 m
210
Po and
210
Pb are in equilibrium. The
210 Po profiles in the upper thermocline have been
modeled to obtain eddy diffusion coefficients and
derive fluxes of nutrients into the euphotic zone from
its base. The nature of
210 Po profiles in the thermocline and the observation that it is enriched in phytoand zooplankton indicates that it is a ‘nutrient like’
element in its behavior and organic matter cycling
significantly influences its distribution in the sea. The
strong dependence of
210 Po removal rate on chlorophyll a abundance in various oceans (Figure 8) is
another proof for the coupling between
210
Po and
biological activity. In deep and bottom waters,
210 Po
and
210
Pb are generally in equilibrium except in areas
of hydrothermal activity where Fe/Mn oxides cause
preferential removal of
210
Po resulting in
210
Po/
210 Pb
activity ratio o1.
The studies of
210 Pb–
226 Ra systematics in the
oceans have considerably enhanced our understanding of scavenging processes, particularly in the deep
sea and the marine geochemistries of lead and its
chemical homologues.
210 Pb occurs in excess over
226 Ra in surface water (Figure 9) resulting from its
supply from the atmosphere. This excess, however, is
less than that would be expected from the known
0
Depth (m)
400
800
6
Activity (d.p.m. (100 kg) –1 )
210 Po/ 210 Pb
9
12 0.4
1.0
1.6
Figure 7
210
Po–
210 Pb disequilibrium in the Indian Ocean.
210 Po
( ) is deficient relative to
210 Pb (J) near the surface and is in
excess at 100–200 m. Data from Cochran et al. (1983).
Red Sea
Off Mexico
Arabian
Sea
Mediterranean
Bay of Bengal
210
Po Removal rate constant (y
–1
)
4
2
0
0.2
0.4
0.6
N. Atlantic
Caribbean
S. China Sea
N. Pacific
Chlorophyll a (μg l
–1
)
0
Figure 8 Interrelation between
210
Po scavenging rate and
chlorophyll a concentrations in various oceanic regions. (Modified
from Nozaki et al., 1998.)
210
Pb excess (d.p.m. (100 kg)
–1 )
0
0
1 0
2 0
3 0
1000
Depth (m)
2000
Figure 9
210
Pb excess over
226 Ra in the upper thermocline
from several stations of the Pacific. This excess results from its
atmospheric deposition. (Modified from Nozaki et al., 1980.)
URANIUM-THORIUM SERIES ISOTOPES IN OCEAN PROFILES 219
230 Th and
231 Pa
using sediment traps and
230 Th/
231 Pa ratios in sediments from various oceanic regions support this
connection.
210 Po is supplied to sea almost entirely through its
in situ production from the decay of
210 Pb (Figure 1),
a minor contribution comes from its atmospheric
deposition at the air–sea interface.
210 Po is deficient
relative to
210 Pb in surface waters (
210
Po/
210 Pb
B0.5, Figure 7), the deficiency being more pronounced in biologically productive regimes. The
residence time of
210 Po in surface waters of the world
oceans is in the range of 170.5 years. The
210 Po/
210 Pb ratio at the base of the euphotic zone
falls between 1.0 and 2.0 and often exceeds the
secular equilibrium value of unity (Figure 7), below
B200 m
210
Po and
210
Pb are in equilibrium. The
210 Po profiles in the upper thermocline have been
modeled to obtain eddy diffusion coefficients and
derive fluxes of nutrients into the euphotic zone from
its base. The nature of
210 Po profiles in the thermocline and the observation that it is enriched in phytoand zooplankton indicates that it is a ‘nutrient like’
element in its behavior and organic matter cycling
significantly influences its distribution in the sea. The
strong dependence of
210 Po removal rate on chlorophyll a abundance in various oceans (Figure 8) is
another proof for the coupling between
210
Po and
biological activity. In deep and bottom waters,
210 Po
and
210
Pb are generally in equilibrium except in areas
of hydrothermal activity where Fe/Mn oxides cause
preferential removal of
210
Po resulting in
210
Po/
210 Pb
activity ratio o1.
The studies of
210 Pb–
226 Ra systematics in the
oceans have considerably enhanced our understanding of scavenging processes, particularly in the deep
sea and the marine geochemistries of lead and its
chemical homologues.
210 Pb occurs in excess over
226 Ra in surface water (Figure 9) resulting from its
supply from the atmosphere. This excess, however, is
less than that would be expected from the known
0
Depth (m)
400
800
6
Activity (d.p.m. (100 kg) –1 )
210 Po/ 210 Pb
9
12 0.4
1.0
1.6
Figure 7
210
Po–
210 Pb disequilibrium in the Indian Ocean.
210 Po
( ) is deficient relative to
210 Pb (J) near the surface and is in
excess at 100–200 m. Data from Cochran et al. (1983).
Red Sea
Off Mexico
Arabian
Sea
Mediterranean
Bay of Bengal
210
Po Removal rate constant (y
–1
)
4
2
0
0.2
0.4
0.6
N. Atlantic
Caribbean
S. China Sea
N. Pacific
Chlorophyll a (μg l
–1
)
0
Figure 8 Interrelation between
210
Po scavenging rate and
chlorophyll a concentrations in various oceanic regions. (Modified
from Nozaki et al., 1998.)
210
Pb excess (d.p.m. (100 kg)
–1 )
0
0
1 0
2 0
3 0
1000
Depth (m)
2000
Figure 9
210
Pb excess over
226 Ra in the upper thermocline
from several stations of the Pacific. This excess results from its
atmospheric deposition. (Modified from Nozaki et al., 1980.)
URANIUM-THORIUM SERIES ISOTOPES IN OCEAN PROFILES 219