

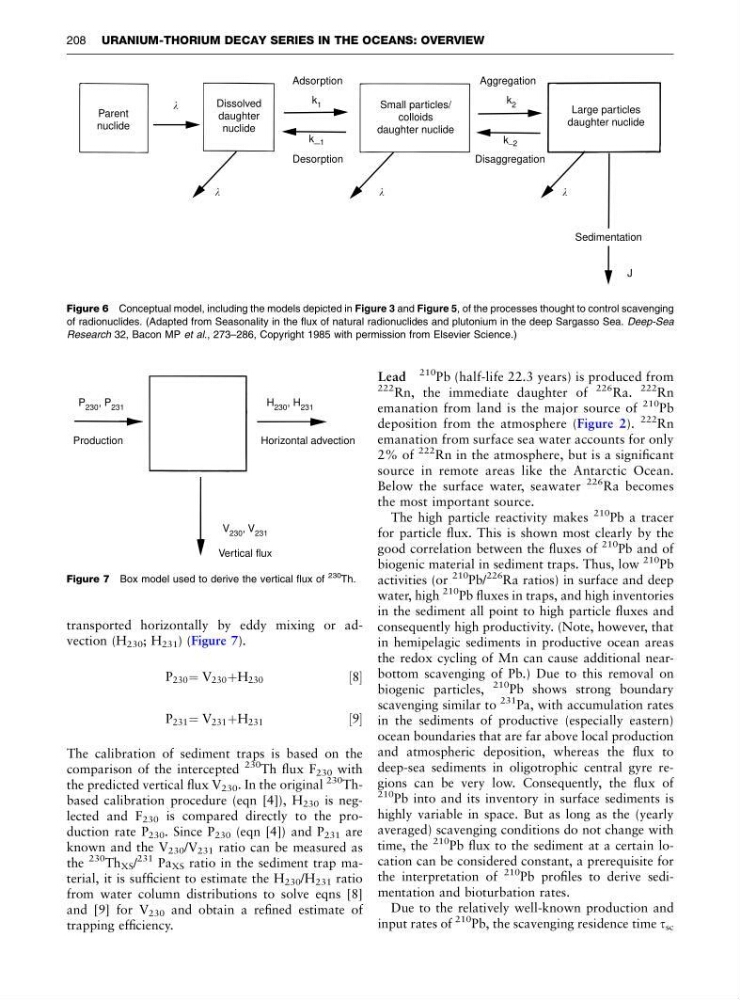
transported horizontally by eddy mixing or advection (H 230 ; H 231 ) (Figure 7).
P 230 ¼ V 230 þH 230
½8
P 231 ¼ V 231 þH 231
½9
The calibration of sediment traps is based on the
comparison of the intercepted
230 Th flux F 230 with
the predicted vertical flux V 230 . In the original
230 Thbased calibration procedure (eqn [4]), H 230 is neglected and F 230 is compared directly to the production rate P 230 . Since P 230 (eqn [4]) and P 231 are
known and the V 230 /V 231 ratio can be measured as
the
230 Th XS /
231 Pa XS ratio in the sediment trap material, it is sufficient to estimate the H 230 /H 231 ratio
from water column distributions to solve eqns [8]
and [9] for V 230 and obtain a refined estimate of
trapping efficiency.
Lead
210 Pb (half-life 22.3 years) is produced from
222 Rn, the immediate daughter of
226 Ra.
222 Rn
emanation from land is the major source of
210 Pb
deposition from the atmosphere (Figure 2).
222 Rn
emanation from surface sea water accounts for only
2% of
222 Rn in the atmosphere, but is a significant
source in remote areas like the Antarctic Ocean.
Below the surface water, seawater
226 Ra becomes
the most important source.
The high particle reactivity makes
210 Pb a tracer
for particle flux. This is shown most clearly by the
good correlation between the fluxes of
210 Pb and of
biogenic material in sediment traps. Thus, low
210 Pb
activities (or
210
Pb/
226
Ra ratios) in surface and deep
water, high
210 Pb fluxes in traps, and high inventories
in the sediment all point to high particle fluxes and
consequently high productivity. (Note, however, that
in hemipelagic sediments in productive ocean areas
the redox cycling of Mn can cause additional nearbottom scavenging of Pb.) Due to this removal on
biogenic particles,
210 Pb shows strong boundary
scavenging similar to
231 Pa, with accumulation rates
in the sediments of productive (especially eastern)
ocean boundaries that are far above local production
and atmospheric deposition, whereas the flux to
deep-sea sediments in oligotrophic central gyre regions can be very low. Consequently, the flux of
210 Pb into and its inventory in surface sediments is
highly variable in space. But as long as the (yearly
averaged) scavenging conditions do not change with
time, the
210 Pb flux to the sediment at a certain location can be considered constant, a prerequisite for
the interpretation of
210 Pb profiles to derive sedimentation and bioturbation rates.
Due to the relatively well-known production and
input rates of
210 Pb, the scavenging residence time t sc
Adsorption
Desorption
k 1
k_ 1
Aggregation
k 2
k_ 2
Large particles
daughter nuclide
Small particles/
colloids
daughter nuclide
Parent
nuclide
Dissolved
daughter
nuclide
J
Disaggregation
Sedimentation
Figure 6 Conceptual model, including the models depicted in Figure 3 and Figure 5, of the processes thought to control scavenging
of radionuclides. (Adapted from Seasonality in the flux of natural radionuclides and plutonium in the deep Sargasso Sea. Deep-Sea
Research 32, Bacon MP et al., 273–286, Copyright 1985 with permission from Elsevier Science.)
P 230 , P 231
H 230 , H 231
Production
Horizontal advection
V 230 , V 231
Vertical flux
Figure 7 Box model used to derive the vertical flux of
230
Th.
208 URANIUM-THORIUM DECAY SERIES IN THE OCEANS: OVERVIEW
P 230 ¼ V 230 þH 230
½8
P 231 ¼ V 231 þH 231
½9
The calibration of sediment traps is based on the
comparison of the intercepted
230 Th flux F 230 with
the predicted vertical flux V 230 . In the original
230 Thbased calibration procedure (eqn [4]), H 230 is neglected and F 230 is compared directly to the production rate P 230 . Since P 230 (eqn [4]) and P 231 are
known and the V 230 /V 231 ratio can be measured as
the
230 Th XS /
231 Pa XS ratio in the sediment trap material, it is sufficient to estimate the H 230 /H 231 ratio
from water column distributions to solve eqns [8]
and [9] for V 230 and obtain a refined estimate of
trapping efficiency.
Lead
210 Pb (half-life 22.3 years) is produced from
222 Rn, the immediate daughter of
226 Ra.
222 Rn
emanation from land is the major source of
210 Pb
deposition from the atmosphere (Figure 2).
222 Rn
emanation from surface sea water accounts for only
2% of
222 Rn in the atmosphere, but is a significant
source in remote areas like the Antarctic Ocean.
Below the surface water, seawater
226 Ra becomes
the most important source.
The high particle reactivity makes
210 Pb a tracer
for particle flux. This is shown most clearly by the
good correlation between the fluxes of
210 Pb and of
biogenic material in sediment traps. Thus, low
210 Pb
activities (or
210
Pb/
226
Ra ratios) in surface and deep
water, high
210 Pb fluxes in traps, and high inventories
in the sediment all point to high particle fluxes and
consequently high productivity. (Note, however, that
in hemipelagic sediments in productive ocean areas
the redox cycling of Mn can cause additional nearbottom scavenging of Pb.) Due to this removal on
biogenic particles,
210 Pb shows strong boundary
scavenging similar to
231 Pa, with accumulation rates
in the sediments of productive (especially eastern)
ocean boundaries that are far above local production
and atmospheric deposition, whereas the flux to
deep-sea sediments in oligotrophic central gyre regions can be very low. Consequently, the flux of
210 Pb into and its inventory in surface sediments is
highly variable in space. But as long as the (yearly
averaged) scavenging conditions do not change with
time, the
210 Pb flux to the sediment at a certain location can be considered constant, a prerequisite for
the interpretation of
210 Pb profiles to derive sedimentation and bioturbation rates.
Due to the relatively well-known production and
input rates of
210 Pb, the scavenging residence time t sc
Adsorption
Desorption
k 1
k_ 1
Aggregation
k 2
k_ 2
Large particles
daughter nuclide
Small particles/
colloids
daughter nuclide
Parent
nuclide
Dissolved
daughter
nuclide
J
Disaggregation
Sedimentation
Figure 6 Conceptual model, including the models depicted in Figure 3 and Figure 5, of the processes thought to control scavenging
of radionuclides. (Adapted from Seasonality in the flux of natural radionuclides and plutonium in the deep Sargasso Sea. Deep-Sea
Research 32, Bacon MP et al., 273–286, Copyright 1985 with permission from Elsevier Science.)
P 230 , P 231
H 230 , H 231
Production
Horizontal advection
V 230 , V 231
Vertical flux
Figure 7 Box model used to derive the vertical flux of
230
Th.
208 URANIUM-THORIUM DECAY SERIES IN THE OCEANS: OVERVIEW