

tracer fluxes across the boundaries. These massive
data requirements cannot be met for any known
transient tracer, and it seems necessary to adapt the
inverse methodology for inclusion of sparse timedependent and steady-state tracers.
A hybrid model consisting of forward and inverse
steps and utilizing the Lagrange multiplier method of
constrained variational optimization for fitting the
model to tracer data has been developed for this
purpose. The model exploits data for many tracers,
including nutrients, radiocarbons, and CFCs. The
objective of the model is to find optimal threedimensional (3-D) global ocean flows, biological
production rates, and depth-dependent downward
particle fluxes that explain the observed tracer, nutrient, and oxygen distributions best. The optimization is done iteratively, varying the flows as well as
the biogeochemical parameters systematically until
the agreement between model simulated tracer fields
and observations is optimal.
The particular model has a rectangular grid
(Figure 5), where grid cell boundaries are not required to match lines of available data. The layout of
the grid is decoupled from the that of the available
data, and individual grid cells (boxes) may be void of
any data. Model tracer values are defined at the
center of the boxes, whereas flows are defined on the
interfaces. Biological production of particulate material occurs in the top model layers representing the
euphotic zone. Particle fluxes below the euphotic
zone are assumed to decrease with depth following a
functional relationship from the literature
j P ðzÞ ¼ a Á ðz=z EZ Þ
Àb
½10
10
−50
−10
−160
−240
−410
−90
−70
−210
−180
−60
−70
−240
4340
4300
4090
4620
4700
190
270
80
24.3(67m)
26.44(162m)
26.44(183m)
60° N
30° N
0°
30° S
26.8(378m)
60° S
NITA
1 × 10 2 kmol s −1
20 × 10 2 kmol s −1
Uncertainty
+1 mol yr
−1 m
−2
−1 mol yr −1 m −2
60° W
6 0 ° E
1 2 0 ° E
1 8 0 ° W
1 2 0 ° W
0°
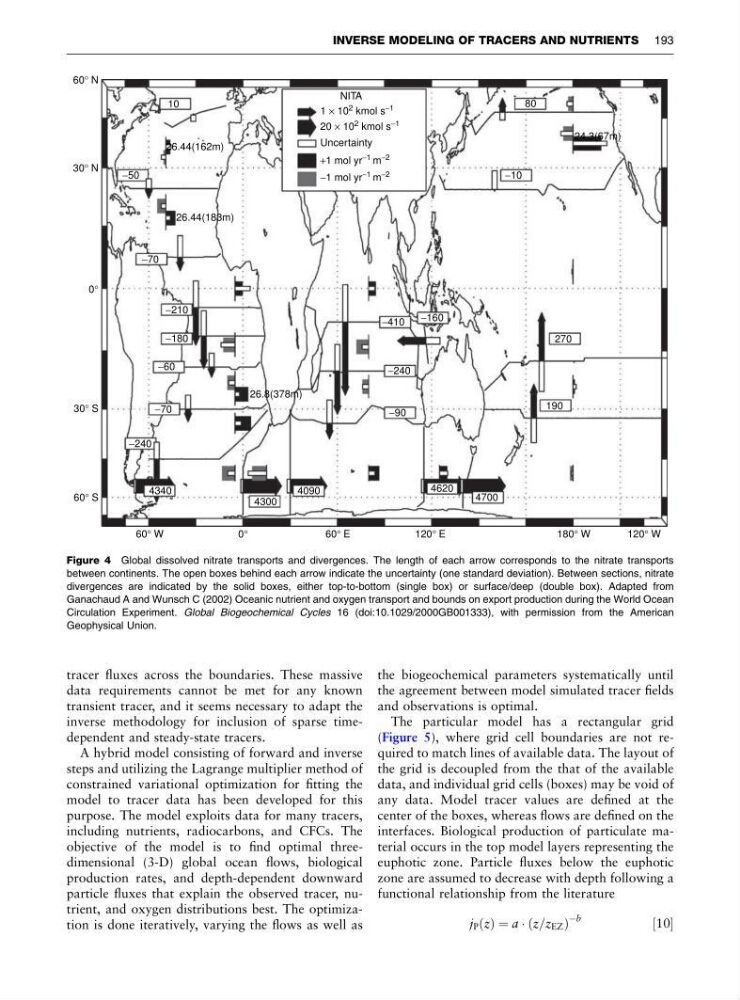
Figure 4 Global dissolved nitrate transports and divergences. The length of each arrow corresponds to the nitrate transports
between continents. The open boxes behind each arrow indicate the uncertainty (one standard deviation). Between sections, nitrate
divergences are indicated by the solid boxes, either top-to-bottom (single box) or surface/deep (double box). Adapted from
Ganachaud A and Wunsch C (2002) Oceanic nutrient and oxygen transport and bounds on export production during the World Ocean
Circulation Experiment. Global Biogeochemical Cycles 16 (doi:10.1029/2000GB001333), with permission from the American
Geophysical Union.
INVERSE MODELING OF TRACERS AND NUTRIENTS 193
data requirements cannot be met for any known
transient tracer, and it seems necessary to adapt the
inverse methodology for inclusion of sparse timedependent and steady-state tracers.
A hybrid model consisting of forward and inverse
steps and utilizing the Lagrange multiplier method of
constrained variational optimization for fitting the
model to tracer data has been developed for this
purpose. The model exploits data for many tracers,
including nutrients, radiocarbons, and CFCs. The
objective of the model is to find optimal threedimensional (3-D) global ocean flows, biological
production rates, and depth-dependent downward
particle fluxes that explain the observed tracer, nutrient, and oxygen distributions best. The optimization is done iteratively, varying the flows as well as
the biogeochemical parameters systematically until
the agreement between model simulated tracer fields
and observations is optimal.
The particular model has a rectangular grid
(Figure 5), where grid cell boundaries are not required to match lines of available data. The layout of
the grid is decoupled from the that of the available
data, and individual grid cells (boxes) may be void of
any data. Model tracer values are defined at the
center of the boxes, whereas flows are defined on the
interfaces. Biological production of particulate material occurs in the top model layers representing the
euphotic zone. Particle fluxes below the euphotic
zone are assumed to decrease with depth following a
functional relationship from the literature
j P ðzÞ ¼ a Á ðz=z EZ Þ
Àb
½10
10
−50
−10
−160
−240
−410
−90
−70
−210
−180
−60
−70
−240
4340
4300
4090
4620
4700
190
270
80
24.3(67m)
26.44(162m)
26.44(183m)
60° N
30° N
0°
30° S
26.8(378m)
60° S
NITA
1 × 10 2 kmol s −1
20 × 10 2 kmol s −1
Uncertainty
+1 mol yr
−1 m
−2
−1 mol yr −1 m −2
60° W
6 0 ° E
1 2 0 ° E
1 8 0 ° W
1 2 0 ° W
0°
Figure 4 Global dissolved nitrate transports and divergences. The length of each arrow corresponds to the nitrate transports
between continents. The open boxes behind each arrow indicate the uncertainty (one standard deviation). Between sections, nitrate
divergences are indicated by the solid boxes, either top-to-bottom (single box) or surface/deep (double box). Adapted from
Ganachaud A and Wunsch C (2002) Oceanic nutrient and oxygen transport and bounds on export production during the World Ocean
Circulation Experiment. Global Biogeochemical Cycles 16 (doi:10.1029/2000GB001333), with permission from the American
Geophysical Union.
INVERSE MODELING OF TRACERS AND NUTRIENTS 193