

the euphotic zone. This approach relies on the
premise that the physical mechanisms that serve to
transport nutrients to the euphotic zone from the
nutrient-rich waters below also carry other tracers in
fixed proportion. If the rate at which these other
tracers are transported can be determined, and the
nutrient to tracer ratio at the ‘source’ is known, then
the corresponding nutrient flux may be inferred;
that is:
F Nutrient ¼
Nutrient
Tracer
!
Source
 F Tracer
Inasmuch as there may be alternate, biologically
mediated pathways (such as zooplankton migration),
such a calculation would serve as an underestimate
to the total nutrient flux.
Measurements of the rare, inert isotope
3
He in the
mixed layer of the Sargasso Sea near Bermuda reveal
a persistent excess of this isotope over solubility
equilibrium with the atmosphere (Figure 4). The
existence of this excess implies a flux of this isotope
to the atmosphere, which can be calculated using the
estimated gas exchange rate. Although
3 He is produced in the water by the in situ decay of tritium, it
can be shown that only about 10% of the observed
flux can be explained by tritium decay within the
euphotic zone. The greater portion of this
3 He flux
arises from the upward ‘exhalation’ of old tritiumproduced
3 He from the waters below. That is, the
3 He flux observed leaving the surface ocean is largely
the loss of this isotope from the main thermocline.
The ocean–atmosphere flux of
3 He shows a pronounced seasonal variation, with the greatest fluxes
in the winter months. The winter maximum is due to
high rates of gas exchange (more vigorous winter
winds lead to higher gas exchange rates) and deeper
winter convection. This is the time history of the
3
He
flux out of the upper ocean. The time history of the
3 He flux to the upper ocean may be different.
However, the annual mean fluxes must be the same,
since the winter mixed layer penetrates below the
bottom of the euphotic zone. The annual average
3 He flux from the ocean surface near Bermuda is
1.8470.25%-m d
À1
. To estimate the flux of
3
He
entering the euphotic zone from below, this flux must
be corrected for the in situ production of
3
He by the
decay of tritium within the euphotic zone, which
produces a
3 He flux of 0.2070.02%-m d
À1 . The
resultant flux is thus 1.6470.25%-m d
À1 .
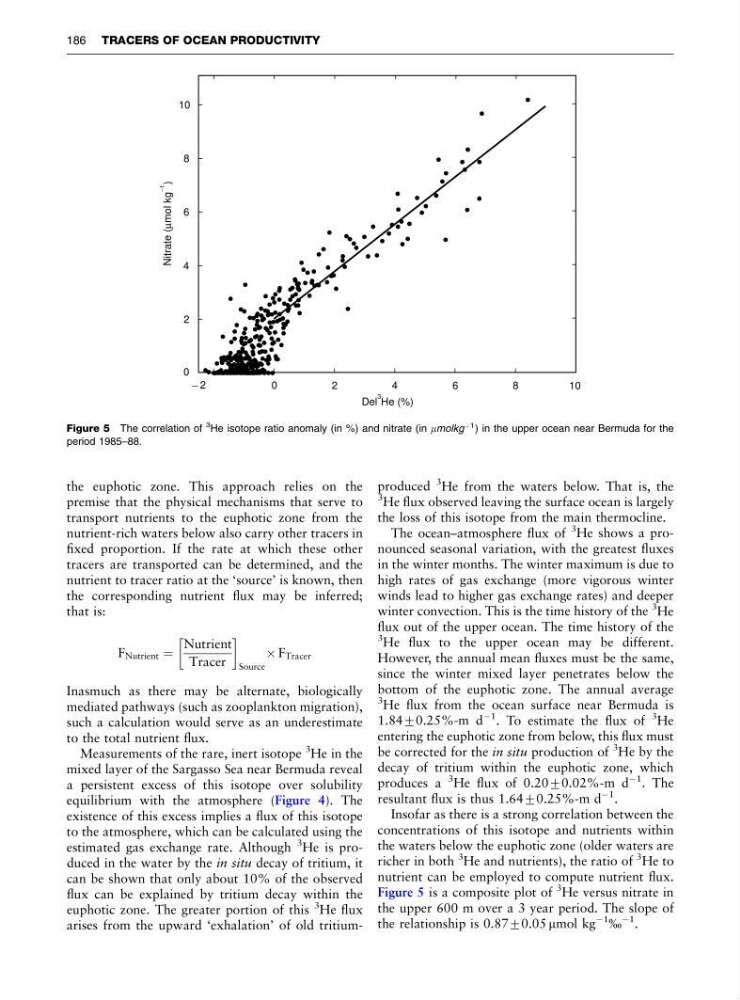
Insofar as there is a strong correlation between the
concentrations of this isotope and nutrients within
the waters below the euphotic zone (older waters are
richer in both
3
He and nutrients), the ratio of
3 He to
nutrient can be employed to compute nutrient flux.
Figure 5 is a composite plot of
3 He versus nitrate in
the upper 600 m over a 3 year period. The slope of
the relationship is 0.8770.05 mmol kg
À1
%
À1 .
_ 2
0
2
4
6
8
10
0
2
4
6
8
10
Del He (%)
3
Nitrate ( mol kg )
μ
_ 1
Figure 5 The correlation of
3 He isotope ratio anomaly (in %) and nitrate (in mmolkg
À1 ) in the upper ocean near Bermuda for the
period 1985–88.
186 TRACERS OF OCEAN PRODUCTIVITY
premise that the physical mechanisms that serve to
transport nutrients to the euphotic zone from the
nutrient-rich waters below also carry other tracers in
fixed proportion. If the rate at which these other
tracers are transported can be determined, and the
nutrient to tracer ratio at the ‘source’ is known, then
the corresponding nutrient flux may be inferred;
that is:
F Nutrient ¼
Nutrient
Tracer
!
Source
 F Tracer
Inasmuch as there may be alternate, biologically
mediated pathways (such as zooplankton migration),
such a calculation would serve as an underestimate
to the total nutrient flux.
Measurements of the rare, inert isotope
3
He in the
mixed layer of the Sargasso Sea near Bermuda reveal
a persistent excess of this isotope over solubility
equilibrium with the atmosphere (Figure 4). The
existence of this excess implies a flux of this isotope
to the atmosphere, which can be calculated using the
estimated gas exchange rate. Although
3 He is produced in the water by the in situ decay of tritium, it
can be shown that only about 10% of the observed
flux can be explained by tritium decay within the
euphotic zone. The greater portion of this
3 He flux
arises from the upward ‘exhalation’ of old tritiumproduced
3 He from the waters below. That is, the
3 He flux observed leaving the surface ocean is largely
the loss of this isotope from the main thermocline.
The ocean–atmosphere flux of
3 He shows a pronounced seasonal variation, with the greatest fluxes
in the winter months. The winter maximum is due to
high rates of gas exchange (more vigorous winter
winds lead to higher gas exchange rates) and deeper
winter convection. This is the time history of the
3
He
flux out of the upper ocean. The time history of the
3 He flux to the upper ocean may be different.
However, the annual mean fluxes must be the same,
since the winter mixed layer penetrates below the
bottom of the euphotic zone. The annual average
3 He flux from the ocean surface near Bermuda is
1.8470.25%-m d
À1
. To estimate the flux of
3
He
entering the euphotic zone from below, this flux must
be corrected for the in situ production of
3
He by the
decay of tritium within the euphotic zone, which
produces a
3 He flux of 0.2070.02%-m d
À1 . The
resultant flux is thus 1.6470.25%-m d
À1 .
Insofar as there is a strong correlation between the
concentrations of this isotope and nutrients within
the waters below the euphotic zone (older waters are
richer in both
3
He and nutrients), the ratio of
3 He to
nutrient can be employed to compute nutrient flux.
Figure 5 is a composite plot of
3 He versus nitrate in
the upper 600 m over a 3 year period. The slope of
the relationship is 0.8770.05 mmol kg
À1
%
À1 .
_ 2
0
2
4
6
8
10
0
2
4
6
8
10
Del He (%)
3
Nitrate ( mol kg )
μ
_ 1
Figure 5 The correlation of
3 He isotope ratio anomaly (in %) and nitrate (in mmolkg
À1 ) in the upper ocean near Bermuda for the
period 1985–88.
186 TRACERS OF OCEAN PRODUCTIVITY