

compared with the background SCO 2 levels. Because of these differences, estimates based on SCO 2
seasonal cycles offer an independent measure of
euphotic zone mass budgets.
Finally, differences in the carbon isotopic ratio
between organic and inorganic carbon, as well as
atmospheric CO 2 , allow the construction of yet a
third mass budget for the euphotic zone. There is a
clear carbon isotope signature that can be modeled
as a function of primary production, air–sea exchange, and mixing with deeper waters.
Tracer Flux-gauge Determinations
The third tracer constraint that may be used to determine primary production involves the use of
‘tracer flux gauges’ to estimate the flux of nutrients to
83
84
85
86
87
88
_ 2.0
_ 1.5
_ 1.0
_ 0.5
0
Year
Mixed
layer
Del
(%)
3
He
Equilibrium
83
84
85
86
87
88
_ 2
0
2
4
6
8
Average = 1.84 + 0.25%
m d
_ 1
Year
3
He
flux
%
m
d
_ 1
(A)
(B)
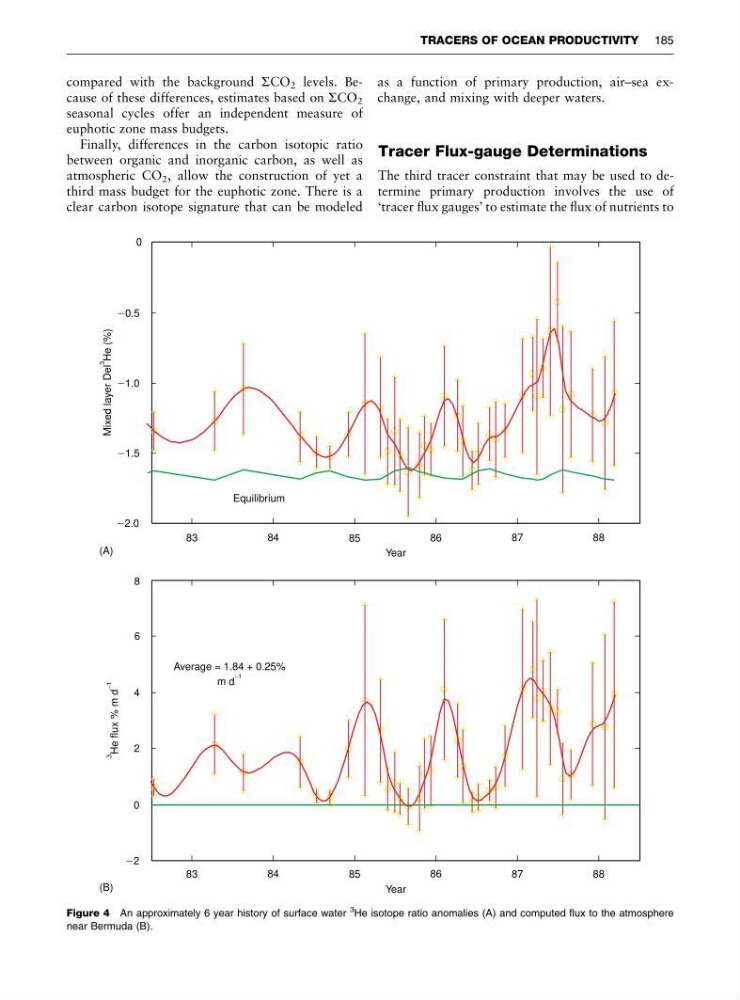
Figure 4 An approximately 6 year history of surface water
3 He isotope ratio anomalies (A) and computed flux to the atmosphere
near Bermuda (B).
TRACERS OF OCEAN PRODUCTIVITY 185
seasonal cycles offer an independent measure of
euphotic zone mass budgets.
Finally, differences in the carbon isotopic ratio
between organic and inorganic carbon, as well as
atmospheric CO 2 , allow the construction of yet a
third mass budget for the euphotic zone. There is a
clear carbon isotope signature that can be modeled
as a function of primary production, air–sea exchange, and mixing with deeper waters.
Tracer Flux-gauge Determinations
The third tracer constraint that may be used to determine primary production involves the use of
‘tracer flux gauges’ to estimate the flux of nutrients to
83
84
85
86
87
88
_ 2.0
_ 1.5
_ 1.0
_ 0.5
0
Year
Mixed
layer
Del
(%)
3
He
Equilibrium
83
84
85
86
87
88
_ 2
0
2
4
6
8
Average = 1.84 + 0.25%
m d
_ 1
Year
3
He
flux
%
m
d
_ 1
(A)
(B)
Figure 4 An approximately 6 year history of surface water
3 He isotope ratio anomalies (A) and computed flux to the atmosphere
near Bermuda (B).
TRACERS OF OCEAN PRODUCTIVITY 185