

Applying the flux equation presented above, a nitrate flux of 0.5670.16 mol m
À2 a
À1 is computed.
Using the average biological C : N ratio of 6.6,
this leads to a carbon fixation rate of 3.77
1.0 mol m
À2 a
À1 . The estimate thus obtained is a
local, annual-scale measure of new production.
A similar calculation can be made by observing the
long-term (decade timescale) trends in thermocline
3 He inventories. The long-term evolution of
3
He inventory in the thermocline must respond to the opposing processes of production by tritium decay and
‘exhalation’ upward to the euphotic zone. Knowing
the former gives the latter. Using nutrient3
He ratios,
a gyre-scale, decadal average estimate of the nutrient
flux to the euphotic zone can be obtained. A detailed
analysis of the long-term trends of tritium and
3
He in
the upper 1000 m of the Sargasso Sea, coupled with
the observed nitrate :
3 He ratios, yields an estimate
of 0.7070.20 mol m
À2 a
À1
. This leads to a somewhat higher carbon fixation rate of 4.671.3 mol
m
À2 a
À1 . This estimate differs from the surface layer
flux calculation in that it is a much longer-term
average, since it depends on the very long-term
evolution of isotopes in the thermocline. Moreover, it
represents a very large-scale gyre-scale determination, rather than a local measure: horizons within
the thermocline probably connect to regions of
higher productivity further north.
Comparing Tracer-derived Estimates
Although the various techniques described here are
based on differing assumptions, and measure different types of production, they should be mutually
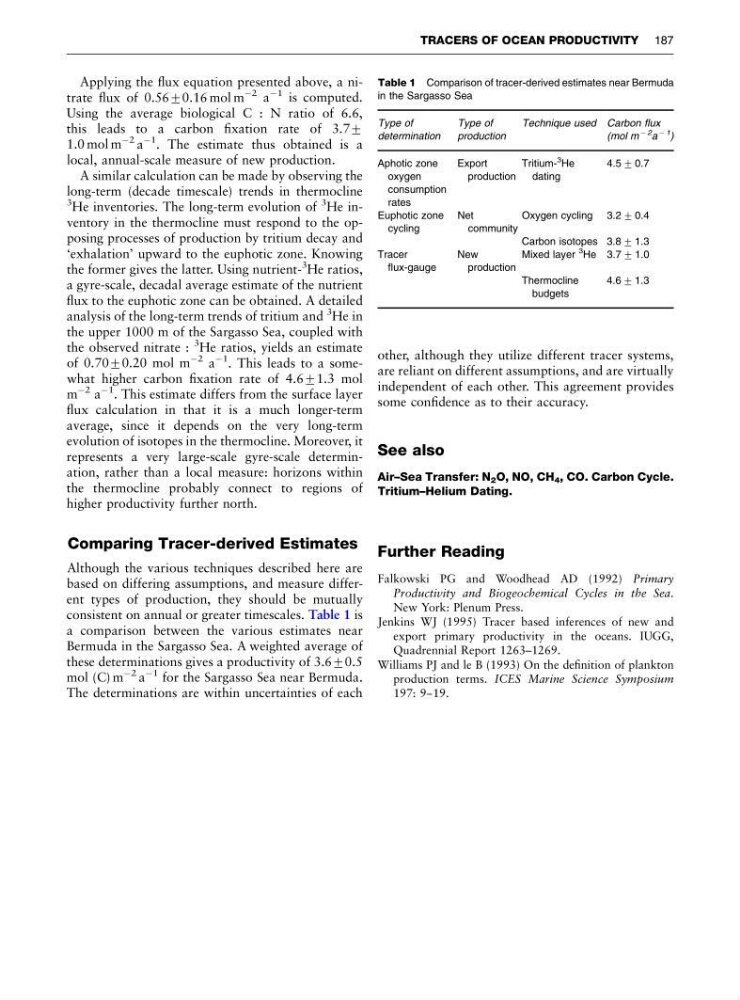
consistent on annual or greater timescales. Table 1 is
a comparison between the various estimates near
Bermuda in the Sargasso Sea. A weighted average of
these determinations gives a productivity of 3.670.5
mol (C) m
À2 a
À1 for the Sargasso Sea near Bermuda.
The determinations are within uncertainties of each
other, although they utilize different tracer systems,
are reliant on different assumptions, and are virtually
independent of each other. This agreement provides
some confidence as to their accuracy.
See also
Air–Sea Transfer: N 2 O, NO, CH 4 , CO. Carbon Cycle.
Tritium–Helium Dating.
Further Reading
Falkowski PG and Woodhead AD (1992) Primary
Productivity and Biogeochemical Cycles in the Sea.
New York: Plenum Press.
Jenkins WJ (1995) Tracer based inferences of new and
export primary productivity in the oceans. IUGG,
Quadrennial Report 1263–1269.
Williams PJ and le B (1993) On the definition of plankton
production terms. ICES Marine Science Symposium
197: 9--19.
Table 1 Comparison of tracer-derived estimates near Bermuda
in the Sargasso Sea
Type of
determination
Type of
production
Technique used Carbon flux
(mol m
À 2 a
À 1
)
Aphotic zone
oxygen
consumption
rates
Export
production
Tritium3 He
dating
4.5 7 0.7
Euphotic zone
cycling
Net
community
Oxygen cycling 3.2 7 0.4
Carbon isotopes 3.8 7 1.3
Tracer
flux-gauge
New
production
Mixed layer
3 He 3.7 7 1.0
Thermocline
budgets
4.6 7 1.3
TRACERS OF OCEAN PRODUCTIVITY 187
À2 a
À1 is computed.
Using the average biological C : N ratio of 6.6,
this leads to a carbon fixation rate of 3.77
1.0 mol m
À2 a
À1 . The estimate thus obtained is a
local, annual-scale measure of new production.
A similar calculation can be made by observing the
long-term (decade timescale) trends in thermocline
3 He inventories. The long-term evolution of
3
He inventory in the thermocline must respond to the opposing processes of production by tritium decay and
‘exhalation’ upward to the euphotic zone. Knowing
the former gives the latter. Using nutrient3
He ratios,
a gyre-scale, decadal average estimate of the nutrient
flux to the euphotic zone can be obtained. A detailed
analysis of the long-term trends of tritium and
3
He in
the upper 1000 m of the Sargasso Sea, coupled with
the observed nitrate :
3 He ratios, yields an estimate
of 0.7070.20 mol m
À2 a
À1
. This leads to a somewhat higher carbon fixation rate of 4.671.3 mol
m
À2 a
À1 . This estimate differs from the surface layer
flux calculation in that it is a much longer-term
average, since it depends on the very long-term
evolution of isotopes in the thermocline. Moreover, it
represents a very large-scale gyre-scale determination, rather than a local measure: horizons within
the thermocline probably connect to regions of
higher productivity further north.
Comparing Tracer-derived Estimates
Although the various techniques described here are
based on differing assumptions, and measure different types of production, they should be mutually
consistent on annual or greater timescales. Table 1 is
a comparison between the various estimates near
Bermuda in the Sargasso Sea. A weighted average of
these determinations gives a productivity of 3.670.5
mol (C) m
À2 a
À1 for the Sargasso Sea near Bermuda.
The determinations are within uncertainties of each
other, although they utilize different tracer systems,
are reliant on different assumptions, and are virtually
independent of each other. This agreement provides
some confidence as to their accuracy.
See also
Air–Sea Transfer: N 2 O, NO, CH 4 , CO. Carbon Cycle.
Tritium–Helium Dating.
Further Reading
Falkowski PG and Woodhead AD (1992) Primary
Productivity and Biogeochemical Cycles in the Sea.
New York: Plenum Press.
Jenkins WJ (1995) Tracer based inferences of new and
export primary productivity in the oceans. IUGG,
Quadrennial Report 1263–1269.
Williams PJ and le B (1993) On the definition of plankton
production terms. ICES Marine Science Symposium
197: 9--19.
Table 1 Comparison of tracer-derived estimates near Bermuda
in the Sargasso Sea
Type of
determination
Type of
production
Technique used Carbon flux
(mol m
À 2 a
À 1
)
Aphotic zone
oxygen
consumption
rates
Export
production
Tritium3 He
dating
4.5 7 0.7
Euphotic zone
cycling
Net
community
Oxygen cycling 3.2 7 0.4
Carbon isotopes 3.8 7 1.3
Tracer
flux-gauge
New
production
Mixed layer
3 He 3.7 7 1.0
Thermocline
budgets
4.6 7 1.3
TRACERS OF OCEAN PRODUCTIVITY 187