

consumption rates can be computed as a function of
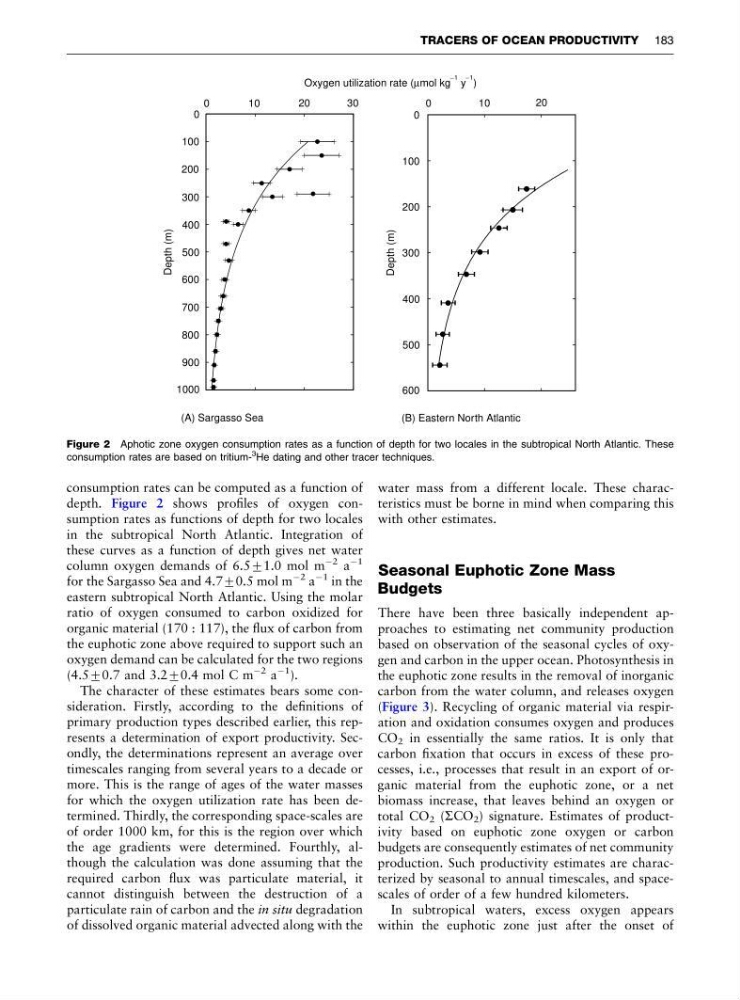
depth. Figure 2 shows profiles of oxygen consumption rates as functions of depth for two locales
in the subtropical North Atlantic. Integration of
these curves as a function of depth gives net water
column oxygen demands of 6.571.0 mol m
À2 a
À1
for the Sargasso Sea and 4.770.5 mol m
À2 a
À1 in the
eastern subtropical North Atlantic. Using the molar
ratio of oxygen consumed to carbon oxidized for
organic material (170 : 117), the flux of carbon from
the euphotic zone above required to support such an
oxygen demand can be calculated for the two regions
(4.570.7 and 3.270.4 mol C m
À2 a
À1 ).
The character of these estimates bears some consideration. Firstly, according to the definitions of
primary production types described earlier, this represents a determination of export productivity. Secondly, the determinations represent an average over
timescales ranging from several years to a decade or
more. This is the range of ages of the water masses
for which the oxygen utilization rate has been determined. Thirdly, the corresponding space-scales are
of order 1000 km, for this is the region over which
the age gradients were determined. Fourthly, although the calculation was done assuming that the
required carbon flux was particulate material, it
cannot distinguish between the destruction of a
particulate rain of carbon and the in situ degradation
of dissolved organic material advected along with the
water mass from a different locale. These characteristics must be borne in mind when comparing this
with other estimates.
Seasonal Euphotic Zone Mass
Budgets
There have been three basically independent approaches to estimating net community production
based on observation of the seasonal cycles of oxygen and carbon in the upper ocean. Photosynthesis in
the euphotic zone results in the removal of inorganic
carbon from the water column, and releases oxygen
(Figure 3). Recycling of organic material via respiration and oxidation consumes oxygen and produces
CO 2 in essentially the same ratios. It is only that
carbon fixation that occurs in excess of these processes, i.e., processes that result in an export of organic material from the euphotic zone, or a net
biomass increase, that leaves behind an oxygen or
total CO 2 (SCO 2 ) signature. Estimates of productivity based on euphotic zone oxygen or carbon
budgets are consequently estimates of net community
production. Such productivity estimates are characterized by seasonal to annual timescales, and spacescales of order of a few hundred kilometers.
In subtropical waters, excess oxygen appears
within the euphotic zone just after the onset of
0
10
20
0
100
200
300
400
500
600
Depth (m)
(B) Eastern North Atlantic
Oxygen utilization rate ( mol kg y )
μ
_ 1 _ 1
0
10
20
30
0
100
200
300
400
500
600
700
800
900
1000
Depth (m)
(A) Sargasso Sea
Figure 2 Aphotic zone oxygen consumption rates as a function of depth for two locales in the subtropical North Atlantic. These
consumption rates are based on tritium3 He dating and other tracer techniques.
TRACERS OF OCEAN PRODUCTIVITY 183
depth. Figure 2 shows profiles of oxygen consumption rates as functions of depth for two locales
in the subtropical North Atlantic. Integration of
these curves as a function of depth gives net water
column oxygen demands of 6.571.0 mol m
À2 a
À1
for the Sargasso Sea and 4.770.5 mol m
À2 a
À1 in the
eastern subtropical North Atlantic. Using the molar
ratio of oxygen consumed to carbon oxidized for
organic material (170 : 117), the flux of carbon from
the euphotic zone above required to support such an
oxygen demand can be calculated for the two regions
(4.570.7 and 3.270.4 mol C m
À2 a
À1 ).
The character of these estimates bears some consideration. Firstly, according to the definitions of
primary production types described earlier, this represents a determination of export productivity. Secondly, the determinations represent an average over
timescales ranging from several years to a decade or
more. This is the range of ages of the water masses
for which the oxygen utilization rate has been determined. Thirdly, the corresponding space-scales are
of order 1000 km, for this is the region over which
the age gradients were determined. Fourthly, although the calculation was done assuming that the
required carbon flux was particulate material, it
cannot distinguish between the destruction of a
particulate rain of carbon and the in situ degradation
of dissolved organic material advected along with the
water mass from a different locale. These characteristics must be borne in mind when comparing this
with other estimates.
Seasonal Euphotic Zone Mass
Budgets
There have been three basically independent approaches to estimating net community production
based on observation of the seasonal cycles of oxygen and carbon in the upper ocean. Photosynthesis in
the euphotic zone results in the removal of inorganic
carbon from the water column, and releases oxygen
(Figure 3). Recycling of organic material via respiration and oxidation consumes oxygen and produces
CO 2 in essentially the same ratios. It is only that
carbon fixation that occurs in excess of these processes, i.e., processes that result in an export of organic material from the euphotic zone, or a net
biomass increase, that leaves behind an oxygen or
total CO 2 (SCO 2 ) signature. Estimates of productivity based on euphotic zone oxygen or carbon
budgets are consequently estimates of net community
production. Such productivity estimates are characterized by seasonal to annual timescales, and spacescales of order of a few hundred kilometers.
In subtropical waters, excess oxygen appears
within the euphotic zone just after the onset of
0
10
20
0
100
200
300
400
500
600
Depth (m)
(B) Eastern North Atlantic
Oxygen utilization rate ( mol kg y )
μ
_ 1 _ 1
0
10
20
30
0
100
200
300
400
500
600
700
800
900
1000
Depth (m)
(A) Sargasso Sea
Figure 2 Aphotic zone oxygen consumption rates as a function of depth for two locales in the subtropical North Atlantic. These
consumption rates are based on tritium3 He dating and other tracer techniques.
TRACERS OF OCEAN PRODUCTIVITY 183