

measurement approaches should be comparable. As
shown below, their quantitative agreement coupled
with their essential independence lends an inductive
support to the validity of their results.
Aphotic Zone Oxygen Consumption
Rates
In the surface ocean air–sea gas exchange controls
the composition of dissolved gases and phytoplankton release oxygen. Below, in the aphotic (nonsunlit) zone, oxygen is generally undersaturated,
because bacterially mediated oxidation of sinking
organic material consumes oxygen. Credible estimates of aphotic zone oxygen consumption rates
have been made since the 1950s. However, the
earliest quantitative linkage to primary production
was in 1982. The principle behind it is dating water
masses and dividing the age of the water mass into
the observed oxygen deficit. Another approach involves correlating water mass age along streamlines
with oxygen concentration (older water has less
oxygen). This dating can be achieved by a technique
such as tritium3
He dating, which uses the ingrowth
of the stable, inert noble gas isotope
3 He from the
decay of the radioactive heavy isotope of hydrogen
(tritium), according to:
3 H -
12:45y 3He
If surface waters are in good gas exchange contact
with the atmosphere, then very little
3
He will accumulate due to tritium decay. Once isolated from the
surface, this
3
He can accumulate. From the measurement
tium3 He age can be computed according to:
t ¼ l
À1 ln 1 þ
3 He
Â
Ã
3 H
½
where l is the decay probability for tritium, and t is
the tritium3
He age (usually given in years). Under
typical Northern Hemispheric conditions with current technology, times ranging from a few months to
a few decades can be determined.
Although a conceptually simple approach, under
normal circumstances mixing must be accounted for
because it can affect the apparent tritium3
He age in
a nonlinear fashion. Furthermore, in regions of
horizontal oxygen gradients, lateral mixing may
significantly affect apparent oxygen consumption
rates. For example, following a fluid parcel as it
moves down a streamline, mixing of oxygen out of
the parcel due to large-scale gradients will masquerade as an augmentation of oxygen consumption
rates. These issues can be accounted for by determining the three-dimensional distributions of these
properties, and applying the appropriate conservation equations. With additional constraints provided by geostrophic velocity calculations, these
effects can be separated and absolute oxygen
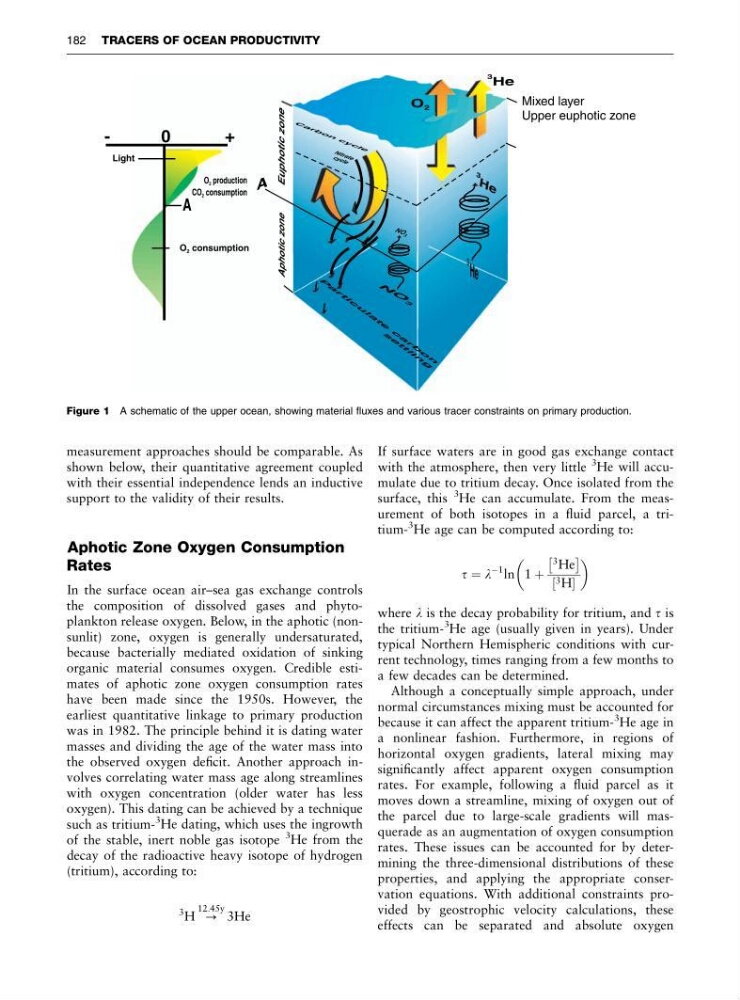
Figure 1 A schematic of the upper ocean, showing material fluxes and various tracer constraints on primary production.
182 TRACERS OF OCEAN PRODUCTIVITY
shown below, their quantitative agreement coupled
with their essential independence lends an inductive
support to the validity of their results.
Aphotic Zone Oxygen Consumption
Rates
In the surface ocean air–sea gas exchange controls
the composition of dissolved gases and phytoplankton release oxygen. Below, in the aphotic (nonsunlit) zone, oxygen is generally undersaturated,
because bacterially mediated oxidation of sinking
organic material consumes oxygen. Credible estimates of aphotic zone oxygen consumption rates
have been made since the 1950s. However, the
earliest quantitative linkage to primary production
was in 1982. The principle behind it is dating water
masses and dividing the age of the water mass into
the observed oxygen deficit. Another approach involves correlating water mass age along streamlines
with oxygen concentration (older water has less
oxygen). This dating can be achieved by a technique
such as tritium3
He dating, which uses the ingrowth
of the stable, inert noble gas isotope
3 He from the
decay of the radioactive heavy isotope of hydrogen
(tritium), according to:
3 H -
12:45y 3He
If surface waters are in good gas exchange contact
with the atmosphere, then very little
3
He will accumulate due to tritium decay. Once isolated from the
surface, this
3
He can accumulate. From the measurement
tium3 He age can be computed according to:
t ¼ l
À1 ln 1 þ
3 He
Â
Ã
3 H
½
where l is the decay probability for tritium, and t is
the tritium3
He age (usually given in years). Under
typical Northern Hemispheric conditions with current technology, times ranging from a few months to
a few decades can be determined.
Although a conceptually simple approach, under
normal circumstances mixing must be accounted for
because it can affect the apparent tritium3
He age in
a nonlinear fashion. Furthermore, in regions of
horizontal oxygen gradients, lateral mixing may
significantly affect apparent oxygen consumption
rates. For example, following a fluid parcel as it
moves down a streamline, mixing of oxygen out of
the parcel due to large-scale gradients will masquerade as an augmentation of oxygen consumption
rates. These issues can be accounted for by determining the three-dimensional distributions of these
properties, and applying the appropriate conservation equations. With additional constraints provided by geostrophic velocity calculations, these
effects can be separated and absolute oxygen
Figure 1 A schematic of the upper ocean, showing material fluxes and various tracer constraints on primary production.
182 TRACERS OF OCEAN PRODUCTIVITY