

nearby effluent from a capacitor manufacturing facility. Those chlorobiphenyl congener mixtures were
also different in composition compared to the PCB
congener mixture in flounder caught in the same area.
The sediment congener mixture for the habitat of
both the lobster and flounder had yet another composition. Biological effects of chlorinated hydrocarbons can be specific to each individual chemical in
terms of mode of action and potency of action. Thus,
the presence of complex and diverse mixtures of these
chemicals in various compartments of an ecosystem
introduces significant complications to the task of
providing an assessment of ecological and human
health risks associated with a given site of chlorinated
hydrocarbon contamination. In addition, the presence of other chemicals of environmental concern in
many of the same areas, means that the present
knowledge base is insufficient to provide a high degree
of accuracy to a quantitative risk assessment for
ecological and human health concerns.
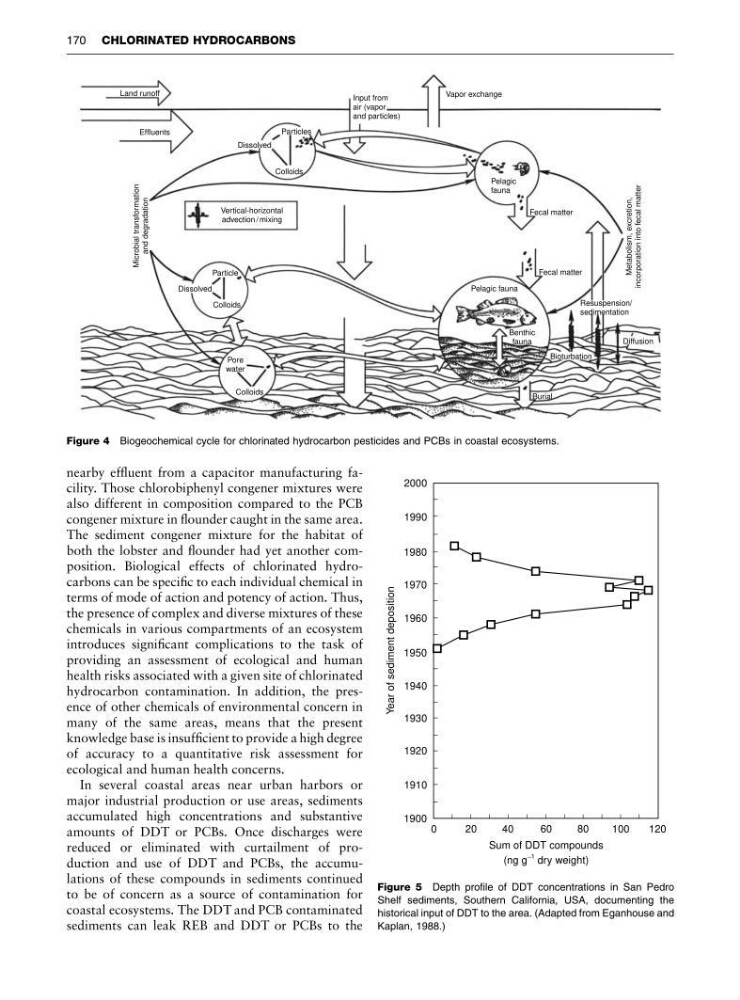
In several coastal areas near urban harbors or
major industrial production or use areas, sediments
accumulated high concentrations and substantive
amounts of DDT or PCBs. Once discharges were
reduced or eliminated with curtailment of production and use of DDT and PCBs, the accumulations of these compounds in sediments continued
to be of concern as a source of contamination for
coastal ecosystems. The DDT and PCB contaminated
sediments can leak REB and DDT or PCBs to the
Land runoff
Effluents
Vapor exchange
Input from
air (vapor
and particles)
Dissolved
Particles
Colloids
Pelagic
fauna
Fecal matter
Fecal matter
Vertical-horizontal
advection / mixing
Dissolved
Colloids
Particle
Colloids
Pore
water
Pelagic fauna
Benthic
fauna
Burial
Bioturbation
Diffusion
Resuspension/
sedimentation
Metabolism, excretion,
incorporation into fecal matter
Microbial transformation
and degradation
Figure 4 Biogeochemical cycle for chlorinated hydrocarbon pesticides and PCBs in coastal ecosystems.
0
20
40
60
80
100
120
1900
1910
1920
1930
1940
1950
1960
1970
1980
1990
2000
Sum of DDT compounds
(ng g dry weight)
_ 1
Year of sediment deposition
Figure 5 Depth profile of DDT concentrations in San Pedro
Shelf sediments, Southern California, USA, documenting the
historical input of DDT to the area. (Adapted from Eganhouse and
Kaplan, 1988.)
170 CHLORINATED HYDROCARBONS
also different in composition compared to the PCB
congener mixture in flounder caught in the same area.
The sediment congener mixture for the habitat of
both the lobster and flounder had yet another composition. Biological effects of chlorinated hydrocarbons can be specific to each individual chemical in
terms of mode of action and potency of action. Thus,
the presence of complex and diverse mixtures of these
chemicals in various compartments of an ecosystem
introduces significant complications to the task of
providing an assessment of ecological and human
health risks associated with a given site of chlorinated
hydrocarbon contamination. In addition, the presence of other chemicals of environmental concern in
many of the same areas, means that the present
knowledge base is insufficient to provide a high degree
of accuracy to a quantitative risk assessment for
ecological and human health concerns.
In several coastal areas near urban harbors or
major industrial production or use areas, sediments
accumulated high concentrations and substantive
amounts of DDT or PCBs. Once discharges were
reduced or eliminated with curtailment of production and use of DDT and PCBs, the accumulations of these compounds in sediments continued
to be of concern as a source of contamination for
coastal ecosystems. The DDT and PCB contaminated
sediments can leak REB and DDT or PCBs to the
Land runoff
Effluents
Vapor exchange
Input from
air (vapor
and particles)
Dissolved
Particles
Colloids
Pelagic
fauna
Fecal matter
Fecal matter
Vertical-horizontal
advection / mixing
Dissolved
Colloids
Particle
Colloids
Pore
water
Pelagic fauna
Benthic
fauna
Burial
Bioturbation
Diffusion
Resuspension/
sedimentation
Metabolism, excretion,
incorporation into fecal matter
Microbial transformation
and degradation
Figure 4 Biogeochemical cycle for chlorinated hydrocarbon pesticides and PCBs in coastal ecosystems.
0
20
40
60
80
100
120
1900
1910
1920
1930
1940
1950
1960
1970
1980
1990
2000
Sum of DDT compounds
(ng g dry weight)
_ 1
Year of sediment deposition
Figure 5 Depth profile of DDT concentrations in San Pedro
Shelf sediments, Southern California, USA, documenting the
historical input of DDT to the area. (Adapted from Eganhouse and
Kaplan, 1988.)
170 CHLORINATED HYDROCARBONS