

It has been recognized for several decades that the
distribution of mantle
3 He has great potential for
delineating the patterns of circulation and mixing of
deep and intermediate water masses. This potential is
probably greatest in the Pacific Ocean, becauseof the
strong
3
He signal in that ocean. The helium field
atmid-depth in the Pacific has been mapped in considerable detail (Figure 5). This work has identified
several distinct helium plumes emanating from active
hydrothermal systems distributed along the midocean ridges. In the eastern equatorial Pacific, two
jets of helium-rich water originate at latitude 101N
and at 141S on the crest of the East Pacific Rise
(EPR)and protrude westward into the interior of the
basin. Between these two helium jets there is a
minimum in the
3
He signal on the Equator. This
distinct pattern in the helium distribution requires
westward transport atmid-depth in the core of these
helium plumes, and suggests eastward transport on
the Equator (see dashed arrows in Figure 5). A separate helium plume is present in the far northeast
Pacific produced by input on the Juan de Fuca and
Gorda Ridges(JdFR). Although this helium signal is
weaker than the helium plumes from the EPR, the
JdFR helium is still traceable as a distinct plume that
trends south-west into the interior of the north Pacific basin. Farther south at B201N, a low3
He
tongue penetrates from the west, implying eastward
transport at this latitude. Thus the helium field defines a cyclonic (clockwise) circulation pattern at
B2000 mdepth in the northeast Pacific.
Range of
equilibrium solubility
13 m
4228 m
R R
= A
1852 m
1.5
2.0
2.5
3.0
3.5
3
_ 1
He (fmol kg )
1.5
1.6
1.7
1.8
1.9
2.0
4
_ 1
He (nmol kg )
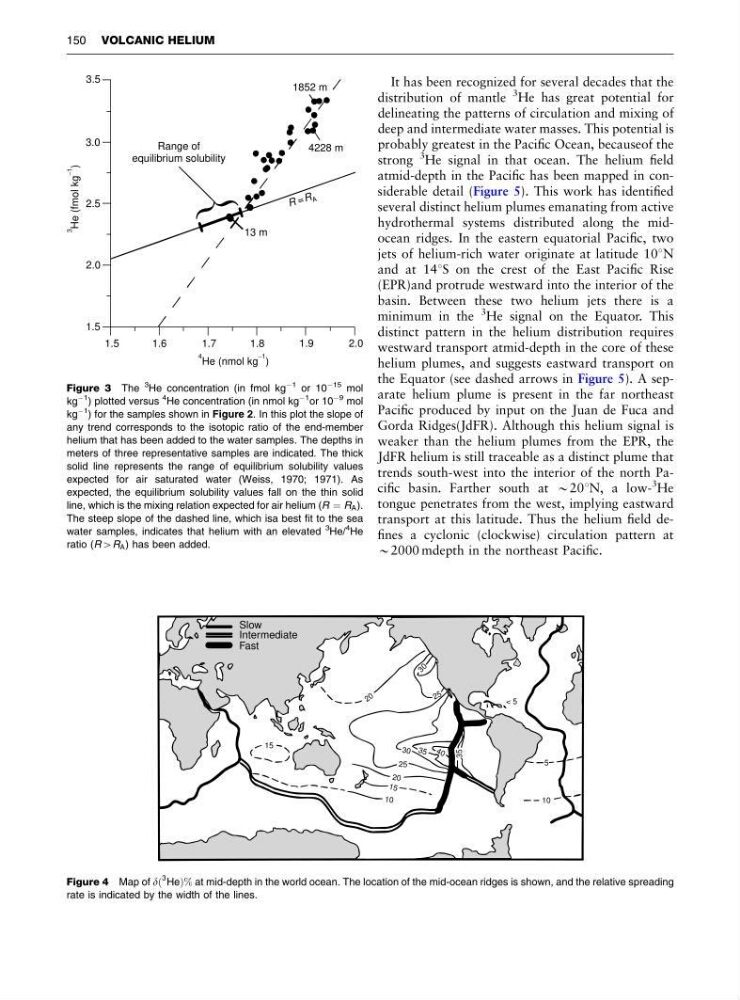
Figure 3 The
3 He concentration (in fmol kg
À1 or 10
À15 mol
kg
À1
) plotted versus
4 He concentration (in nmol kg
À1 or 10
À9 mol
kg
À1
) for the samples shown in Figure 2. In this plot the slope of
any trend corresponds to the isotopic ratio of the end-member
helium that has been added to the water samples. The depths in
meters of three representative samples are indicated. The thick
solid line represents the range of equilibrium solubility values
expected for air saturated water (Weiss, 1970; 1971). As
expected, the equilibrium solubility values fall on the thin solid
line, which is the mixing relation expected for air helium (R ¼ R A ).
The steep slope of the dashed line, which isa best fit to the sea
water samples, indicates that helium with an elevated
3
He/
4 He
ratio (R4R A ) has been added.
Slow
Intermediate
Fast
15
2 0
2 5
3 0
10
15
20
25
30 3 5 4 0
35
10
5
< 5
Figure 4 Map of dð
3 HeÞ% at mid-depth in the world ocean. The location of the mid-ocean ridges is shown, and the relative spreading
rate is indicated by the width of the lines.
150 VOLCANIC HELIUM
distribution of mantle
3 He has great potential for
delineating the patterns of circulation and mixing of
deep and intermediate water masses. This potential is
probably greatest in the Pacific Ocean, becauseof the
strong
3
He signal in that ocean. The helium field
atmid-depth in the Pacific has been mapped in considerable detail (Figure 5). This work has identified
several distinct helium plumes emanating from active
hydrothermal systems distributed along the midocean ridges. In the eastern equatorial Pacific, two
jets of helium-rich water originate at latitude 101N
and at 141S on the crest of the East Pacific Rise
(EPR)and protrude westward into the interior of the
basin. Between these two helium jets there is a
minimum in the
3
He signal on the Equator. This
distinct pattern in the helium distribution requires
westward transport atmid-depth in the core of these
helium plumes, and suggests eastward transport on
the Equator (see dashed arrows in Figure 5). A separate helium plume is present in the far northeast
Pacific produced by input on the Juan de Fuca and
Gorda Ridges(JdFR). Although this helium signal is
weaker than the helium plumes from the EPR, the
JdFR helium is still traceable as a distinct plume that
trends south-west into the interior of the north Pacific basin. Farther south at B201N, a low3
He
tongue penetrates from the west, implying eastward
transport at this latitude. Thus the helium field defines a cyclonic (clockwise) circulation pattern at
B2000 mdepth in the northeast Pacific.
Range of
equilibrium solubility
13 m
4228 m
R R
= A
1852 m
1.5
2.0
2.5
3.0
3.5
3
_ 1
He (fmol kg )
1.5
1.6
1.7
1.8
1.9
2.0
4
_ 1
He (nmol kg )
Figure 3 The
3 He concentration (in fmol kg
À1 or 10
À15 mol
kg
À1
) plotted versus
4 He concentration (in nmol kg
À1 or 10
À9 mol
kg
À1
) for the samples shown in Figure 2. In this plot the slope of
any trend corresponds to the isotopic ratio of the end-member
helium that has been added to the water samples. The depths in
meters of three representative samples are indicated. The thick
solid line represents the range of equilibrium solubility values
expected for air saturated water (Weiss, 1970; 1971). As
expected, the equilibrium solubility values fall on the thin solid
line, which is the mixing relation expected for air helium (R ¼ R A ).
The steep slope of the dashed line, which isa best fit to the sea
water samples, indicates that helium with an elevated
3
He/
4 He
ratio (R4R A ) has been added.
Slow
Intermediate
Fast
15
2 0
2 5
3 0
10
15
20
25
30 3 5 4 0
35
10
5
< 5
Figure 4 Map of dð
3 HeÞ% at mid-depth in the world ocean. The location of the mid-ocean ridges is shown, and the relative spreading
rate is indicated by the width of the lines.
150 VOLCANIC HELIUM