

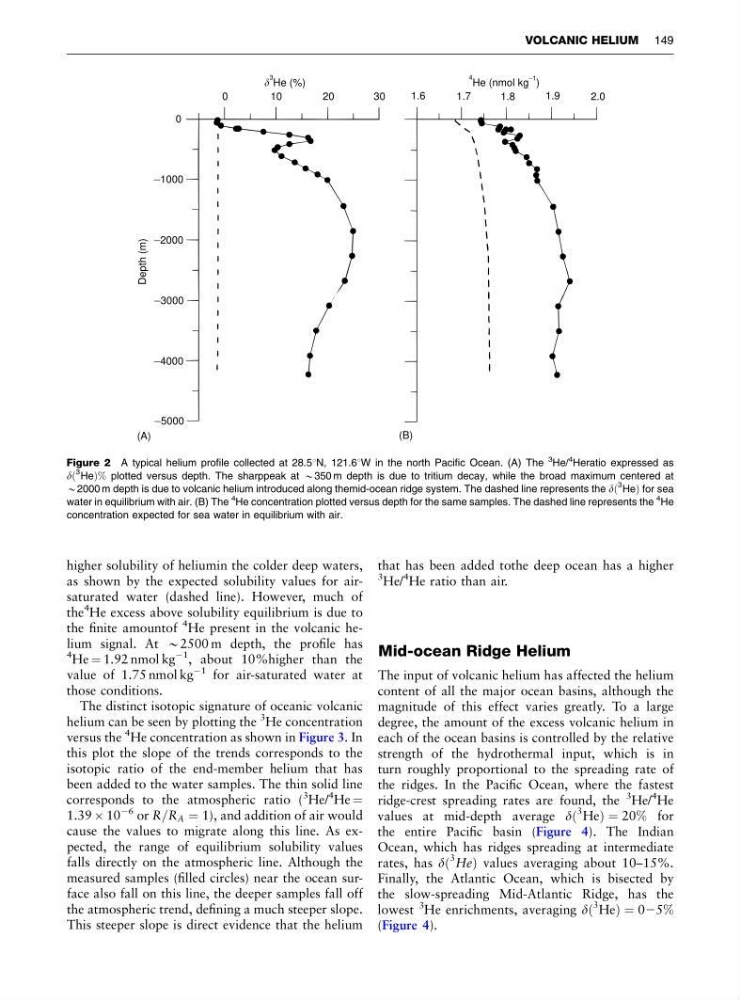
higher solubility of heliumin the colder deep waters,
as shown by the expected solubility values for airsaturated water (dashed line). However, much of
the
4 He excess above solubility equilibrium is due to
the finite amountof
4 He present in the volcanic helium signal. At B2500 m depth, the profile has
4 He ¼ 1.92 nmol kg
À1 , about 10%higher than the
value of 1.75 nmol kg
À1 for air-saturated water at
those conditions.
The distinct isotopic signature of oceanic volcanic
helium can be seen by plotting the
3 He concentration
versus the
4 He concentration as shown in Figure 3. In
this plot the slope of the trends corresponds to the
isotopic ratio of the end-member helium that has
been added to the water samples. The thin solid line
corresponds to the atmospheric ratio (
3 He/
4
He ¼
1.39 Â 10
À6 or R=R A ¼ 1), and addition of air would
cause the values to migrate along this line. As expected, the range of equilibrium solubility values
falls directly on the atmospheric line. Although the
measured samples (filled circles) near the ocean surface also fall on this line, the deeper samples fall off
the atmospheric trend, defining a much steeper slope.
This steeper slope is direct evidence that the helium
that has been added tothe deep ocean has a higher
3 He/
4
He ratio than air.
Mid-ocean Ridge Helium
The input of volcanic helium has affected the helium
content of all the major ocean basins, although the
magnitude of this effect varies greatly. To a large
degree, the amount of the excess volcanic helium in
each of the ocean basins is controlled by the relative
strength of the hydrothermal input, which is in
turn roughly proportional to the spreading rate of
the ridges. In the Pacific Ocean, where the fastest
ridge-crest spreading rates are found, the
3
He/
4
He
values at mid-depth average dð
3 HeÞ ¼ 20% for
the entire Pacific basin (Figure 4). The Indian
Ocean, which has ridges spreading at intermediate
rates, has dð
3 HeÞ values averaging about 10–15%.
Finally, the Atlantic Ocean, which is bisected by
the slow-spreading Mid-Atlantic Ridge, has the
lowest
3
He enrichments, averaging dð
3 HeÞ ¼ 025%
(Figure 4).
0
1 0
2 0
3 0
3
He (%)
0
_ 1000
_ 2000
_ 3000
_ 4000
_ 5000
Depth (m)
1.6
1.7
1.8
1.9
2.0
4
_ 1
He (nmol kg )
(A)
(B)
Figure 2 A typical helium profile collected at 28.51N, 121.61W in the north Pacific Ocean. (A) The
3
He/
4 Heratio expressed as
dð
3 HeÞ% plotted versus depth. The sharppeak at B350 m depth is due to tritium decay, while the broad maximum centered at
B2000 m depth is due to volcanic helium introduced along themid-ocean ridge system. The dashed line represents the dð
3 HeÞ for sea
water in equilibrium with air. (B) The
4
He concentration plotted versus depth for the same samples. The dashed line represents the
4 He
concentration expected for sea water in equilibrium with air.
VOLCANIC HELIUM 149
as shown by the expected solubility values for airsaturated water (dashed line). However, much of
the
4 He excess above solubility equilibrium is due to
the finite amountof
4 He present in the volcanic helium signal. At B2500 m depth, the profile has
4 He ¼ 1.92 nmol kg
À1 , about 10%higher than the
value of 1.75 nmol kg
À1 for air-saturated water at
those conditions.
The distinct isotopic signature of oceanic volcanic
helium can be seen by plotting the
3 He concentration
versus the
4 He concentration as shown in Figure 3. In
this plot the slope of the trends corresponds to the
isotopic ratio of the end-member helium that has
been added to the water samples. The thin solid line
corresponds to the atmospheric ratio (
3 He/
4
He ¼
1.39 Â 10
À6 or R=R A ¼ 1), and addition of air would
cause the values to migrate along this line. As expected, the range of equilibrium solubility values
falls directly on the atmospheric line. Although the
measured samples (filled circles) near the ocean surface also fall on this line, the deeper samples fall off
the atmospheric trend, defining a much steeper slope.
This steeper slope is direct evidence that the helium
that has been added tothe deep ocean has a higher
3 He/
4
He ratio than air.
Mid-ocean Ridge Helium
The input of volcanic helium has affected the helium
content of all the major ocean basins, although the
magnitude of this effect varies greatly. To a large
degree, the amount of the excess volcanic helium in
each of the ocean basins is controlled by the relative
strength of the hydrothermal input, which is in
turn roughly proportional to the spreading rate of
the ridges. In the Pacific Ocean, where the fastest
ridge-crest spreading rates are found, the
3
He/
4
He
values at mid-depth average dð
3 HeÞ ¼ 20% for
the entire Pacific basin (Figure 4). The Indian
Ocean, which has ridges spreading at intermediate
rates, has dð
3 HeÞ values averaging about 10–15%.
Finally, the Atlantic Ocean, which is bisected by
the slow-spreading Mid-Atlantic Ridge, has the
lowest
3
He enrichments, averaging dð
3 HeÞ ¼ 025%
(Figure 4).
0
1 0
2 0
3 0
3
He (%)
0
_ 1000
_ 2000
_ 3000
_ 4000
_ 5000
Depth (m)
1.6
1.7
1.8
1.9
2.0
4
_ 1
He (nmol kg )
(A)
(B)
Figure 2 A typical helium profile collected at 28.51N, 121.61W in the north Pacific Ocean. (A) The
3
He/
4 Heratio expressed as
dð
3 HeÞ% plotted versus depth. The sharppeak at B350 m depth is due to tritium decay, while the broad maximum centered at
B2000 m depth is due to volcanic helium introduced along themid-ocean ridge system. The dashed line represents the dð
3 HeÞ for sea
water in equilibrium with air. (B) The
4
He concentration plotted versus depth for the same samples. The dashed line represents the
4 He
concentration expected for sea water in equilibrium with air.
VOLCANIC HELIUM 149