

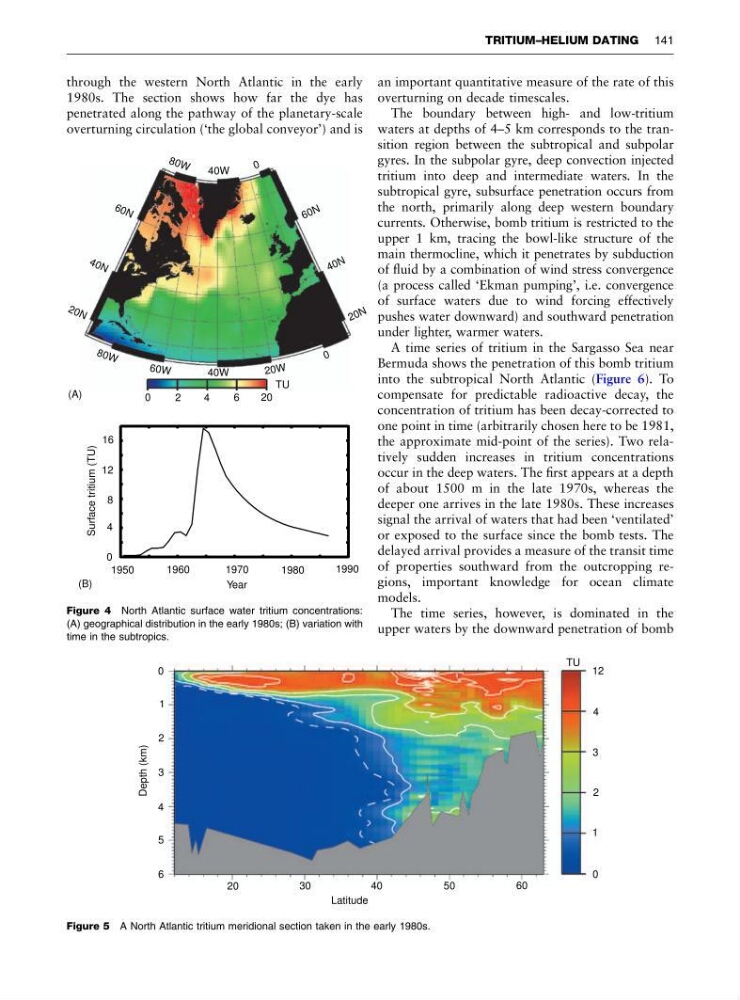
through the western North Atlantic in the early
1980s. The section shows how far the dye has
penetrated along the pathway of the planetary-scale
overturning circulation (‘the global conveyor’) and is
an important quantitative measure of the rate of this
overturning on decade timescales.
The boundary between high- and low-tritium
waters at depths of 4–5 km corresponds to the transition region between the subtropical and subpolar
gyres. In the subpolar gyre, deep convection injected
tritium into deep and intermediate waters. In the
subtropical gyre, subsurface penetration occurs from
the north, primarily along deep western boundary
currents. Otherwise, bomb tritium is restricted to the
upper 1 km, tracing the bowl-like structure of the
main thermocline, which it penetrates by subduction
of fluid by a combination of wind stress convergence
(a process called ‘Ekman pumping’, i.e. convergence
of surface waters due to wind forcing effectively
pushes water downward) and southward penetration
under lighter, warmer waters.
A time series of tritium in the Sargasso Sea near
Bermuda shows the penetration of this bomb tritium
into the subtropical North Atlantic (Figure 6). To
compensate for predictable radioactive decay, the
concentration of tritium has been decay-corrected to
one point in time (arbitrarily chosen here to be 1981,
the approximate mid-point of the series). Two relatively sudden increases in tritium concentrations
occur in the deep waters. The first appears at a depth
of about 1500 m in the late 1970s, whereas the
deeper one arrives in the late 1980s. These increases
signal the arrival of waters that had been ‘ventilated’
or exposed to the surface since the bomb tests. The
delayed arrival provides a measure of the transit time
of properties southward from the outcropping regions, important knowledge for ocean climate
models.
The time series, however, is dominated in the
upper waters by the downward penetration of bomb
8 0 W
8 0 W
60 W
40W
40W
20 W
0
0
2 0 N
2 0 N
4 0 N
4 0 N
6 0 N
6 0 N
0
2
4
6
20
TU
(A)
(B)
1950
1960
1970
1980
1990
0
4
8
12
16
Year
Surface tritium (TU)
Figure 4 North Atlantic surface water tritium concentrations:
(A) geographical distribution in the early 1980s; (B) variation with
time in the subtropics.
0
1
2
3
4
5
6
Depth (km)
20
30
40
50
60
Latitude
0
1
2
3
4
12
TU
Figure 5 A North Atlantic tritium meridional section taken in the early 1980s.
TRITIUM–HELIUM DATING 141
1980s. The section shows how far the dye has
penetrated along the pathway of the planetary-scale
overturning circulation (‘the global conveyor’) and is
an important quantitative measure of the rate of this
overturning on decade timescales.
The boundary between high- and low-tritium
waters at depths of 4–5 km corresponds to the transition region between the subtropical and subpolar
gyres. In the subpolar gyre, deep convection injected
tritium into deep and intermediate waters. In the
subtropical gyre, subsurface penetration occurs from
the north, primarily along deep western boundary
currents. Otherwise, bomb tritium is restricted to the
upper 1 km, tracing the bowl-like structure of the
main thermocline, which it penetrates by subduction
of fluid by a combination of wind stress convergence
(a process called ‘Ekman pumping’, i.e. convergence
of surface waters due to wind forcing effectively
pushes water downward) and southward penetration
under lighter, warmer waters.
A time series of tritium in the Sargasso Sea near
Bermuda shows the penetration of this bomb tritium
into the subtropical North Atlantic (Figure 6). To
compensate for predictable radioactive decay, the
concentration of tritium has been decay-corrected to
one point in time (arbitrarily chosen here to be 1981,
the approximate mid-point of the series). Two relatively sudden increases in tritium concentrations
occur in the deep waters. The first appears at a depth
of about 1500 m in the late 1970s, whereas the
deeper one arrives in the late 1980s. These increases
signal the arrival of waters that had been ‘ventilated’
or exposed to the surface since the bomb tests. The
delayed arrival provides a measure of the transit time
of properties southward from the outcropping regions, important knowledge for ocean climate
models.
The time series, however, is dominated in the
upper waters by the downward penetration of bomb
8 0 W
8 0 W
60 W
40W
40W
20 W
0
0
2 0 N
2 0 N
4 0 N
4 0 N
6 0 N
6 0 N
0
2
4
6
20
TU
(A)
(B)
1950
1960
1970
1980
1990
0
4
8
12
16
Year
Surface tritium (TU)
Figure 4 North Atlantic surface water tritium concentrations:
(A) geographical distribution in the early 1980s; (B) variation with
time in the subtropics.
0
1
2
3
4
5
6
Depth (km)
20
30
40
50
60
Latitude
0
1
2
3
4
12
TU
Figure 5 A North Atlantic tritium meridional section taken in the early 1980s.
TRITIUM–HELIUM DATING 141