

since it results primarily from the cross-equatorial
leakage of northern hemispheric tritium with few
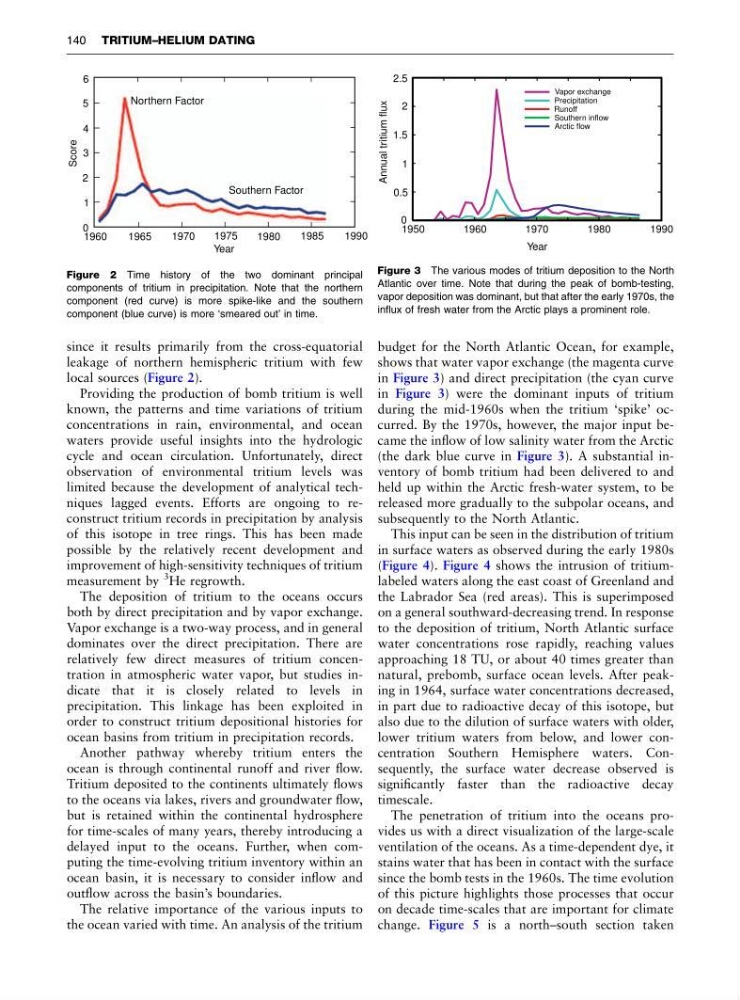
local sources (Figure 2).
Providing the production of bomb tritium is well
known, the patterns and time variations of tritium
concentrations in rain, environmental, and ocean
waters provide useful insights into the hydrologic
cycle and ocean circulation. Unfortunately, direct
observation of environmental tritium levels was
limited because the development of analytical techniques lagged events. Efforts are ongoing to reconstruct tritium records in precipitation by analysis
of this isotope in tree rings. This has been made
possible by the relatively recent development and
improvement of high-sensitivity techniques of tritium
measurement by
3 He regrowth.
The deposition of tritium to the oceans occurs
both by direct precipitation and by vapor exchange.
Vapor exchange is a two-way process, and in general
dominates over the direct precipitation. There are
relatively few direct measures of tritium concentration in atmospheric water vapor, but studies indicate that it is closely related to levels in
precipitation. This linkage has been exploited in
order to construct tritium depositional histories for
ocean basins from tritium in precipitation records.
Another pathway whereby tritium enters the
ocean is through continental runoff and river flow.
Tritium deposited to the continents ultimately flows
to the oceans via lakes, rivers and groundwater flow,
but is retained within the continental hydrosphere
for time-scales of many years, thereby introducing a
delayed input to the oceans. Further, when computing the time-evolving tritium inventory within an
ocean basin, it is necessary to consider inflow and
outflow across the basin’s boundaries.
The relative importance of the various inputs to
the ocean varied with time. An analysis of the tritium
budget for the North Atlantic Ocean, for example,
shows that water vapor exchange (the magenta curve
in Figure 3) and direct precipitation (the cyan curve
in Figure 3) were the dominant inputs of tritium
during the mid-1960s when the tritium ‘spike’ occurred. By the 1970s, however, the major input became the inflow of low salinity water from the Arctic
(the dark blue curve in Figure 3). A substantial inventory of bomb tritium had been delivered to and
held up within the Arctic fresh-water system, to be
released more gradually to the subpolar oceans, and
subsequently to the North Atlantic.
This input can be seen in the distribution of tritium
in surface waters as observed during the early 1980s
(Figure 4). Figure 4 shows the intrusion of tritiumlabeled waters along the east coast of Greenland and
the Labrador Sea (red areas). This is superimposed
on a general southward-decreasing trend. In response
to the deposition of tritium, North Atlantic surface
water concentrations rose rapidly, reaching values
approaching 18 TU, or about 40 times greater than
natural, prebomb, surface ocean levels. After peaking in 1964, surface water concentrations decreased,
in part due to radioactive decay of this isotope, but
also due to the dilution of surface waters with older,
lower tritium waters from below, and lower concentration Southern Hemisphere waters. Consequently, the surface water decrease observed is
significantly faster than the radioactive decay
timescale.
The penetration of tritium into the oceans provides us with a direct visualization of the large-scale
ventilation of the oceans. As a time-dependent dye, it
stains water that has been in contact with the surface
since the bomb tests in the 1960s. The time evolution
of this picture highlights those processes that occur
on decade time-scales that are important for climate
change. Figure 5 is a north–south section taken
1960
1965
1970
1975
1980
1985
1990
Year
0
1
2
3
4
5
6
Score
Northern Factor
Southern Factor
Figure 2 Time history of the two dominant principal
components of tritium in precipitation. Note that the northern
component (red curve) is more spike-like and the southern
component (blue curve) is more ‘smeared out’ in time.
1950
1960
1970
1980
1990
0.5
1.5
2
2.5
0
1
Year
Annual tritium flux
Vapor exchange
Precipitation
Runoff
Southern inflow
Arctic flow
Figure 3 The various modes of tritium deposition to the North
Atlantic over time. Note that during the peak of bomb-testing,
vapor deposition was dominant, but that after the early 1970s, the
influx of fresh water from the Arctic plays a prominent role.
140 TRITIUM–HELIUM DATING
leakage of northern hemispheric tritium with few
local sources (Figure 2).
Providing the production of bomb tritium is well
known, the patterns and time variations of tritium
concentrations in rain, environmental, and ocean
waters provide useful insights into the hydrologic
cycle and ocean circulation. Unfortunately, direct
observation of environmental tritium levels was
limited because the development of analytical techniques lagged events. Efforts are ongoing to reconstruct tritium records in precipitation by analysis
of this isotope in tree rings. This has been made
possible by the relatively recent development and
improvement of high-sensitivity techniques of tritium
measurement by
3 He regrowth.
The deposition of tritium to the oceans occurs
both by direct precipitation and by vapor exchange.
Vapor exchange is a two-way process, and in general
dominates over the direct precipitation. There are
relatively few direct measures of tritium concentration in atmospheric water vapor, but studies indicate that it is closely related to levels in
precipitation. This linkage has been exploited in
order to construct tritium depositional histories for
ocean basins from tritium in precipitation records.
Another pathway whereby tritium enters the
ocean is through continental runoff and river flow.
Tritium deposited to the continents ultimately flows
to the oceans via lakes, rivers and groundwater flow,
but is retained within the continental hydrosphere
for time-scales of many years, thereby introducing a
delayed input to the oceans. Further, when computing the time-evolving tritium inventory within an
ocean basin, it is necessary to consider inflow and
outflow across the basin’s boundaries.
The relative importance of the various inputs to
the ocean varied with time. An analysis of the tritium
budget for the North Atlantic Ocean, for example,
shows that water vapor exchange (the magenta curve
in Figure 3) and direct precipitation (the cyan curve
in Figure 3) were the dominant inputs of tritium
during the mid-1960s when the tritium ‘spike’ occurred. By the 1970s, however, the major input became the inflow of low salinity water from the Arctic
(the dark blue curve in Figure 3). A substantial inventory of bomb tritium had been delivered to and
held up within the Arctic fresh-water system, to be
released more gradually to the subpolar oceans, and
subsequently to the North Atlantic.
This input can be seen in the distribution of tritium
in surface waters as observed during the early 1980s
(Figure 4). Figure 4 shows the intrusion of tritiumlabeled waters along the east coast of Greenland and
the Labrador Sea (red areas). This is superimposed
on a general southward-decreasing trend. In response
to the deposition of tritium, North Atlantic surface
water concentrations rose rapidly, reaching values
approaching 18 TU, or about 40 times greater than
natural, prebomb, surface ocean levels. After peaking in 1964, surface water concentrations decreased,
in part due to radioactive decay of this isotope, but
also due to the dilution of surface waters with older,
lower tritium waters from below, and lower concentration Southern Hemisphere waters. Consequently, the surface water decrease observed is
significantly faster than the radioactive decay
timescale.
The penetration of tritium into the oceans provides us with a direct visualization of the large-scale
ventilation of the oceans. As a time-dependent dye, it
stains water that has been in contact with the surface
since the bomb tests in the 1960s. The time evolution
of this picture highlights those processes that occur
on decade time-scales that are important for climate
change. Figure 5 is a north–south section taken
1960
1965
1970
1975
1980
1985
1990
Year
0
1
2
3
4
5
6
Score
Northern Factor
Southern Factor
Figure 2 Time history of the two dominant principal
components of tritium in precipitation. Note that the northern
component (red curve) is more spike-like and the southern
component (blue curve) is more ‘smeared out’ in time.
1950
1960
1970
1980
1990
0.5
1.5
2
2.5
0
1
Year
Annual tritium flux
Vapor exchange
Precipitation
Runoff
Southern inflow
Arctic flow
Figure 3 The various modes of tritium deposition to the North
Atlantic over time. Note that during the peak of bomb-testing,
vapor deposition was dominant, but that after the early 1970s, the
influx of fresh water from the Arctic plays a prominent role.
140 TRITIUM–HELIUM DATING